Natural Gas Commodity Elliott Wave Technical Analysis - Friday, November 22
Natural Gas Elliott Wave Analysis
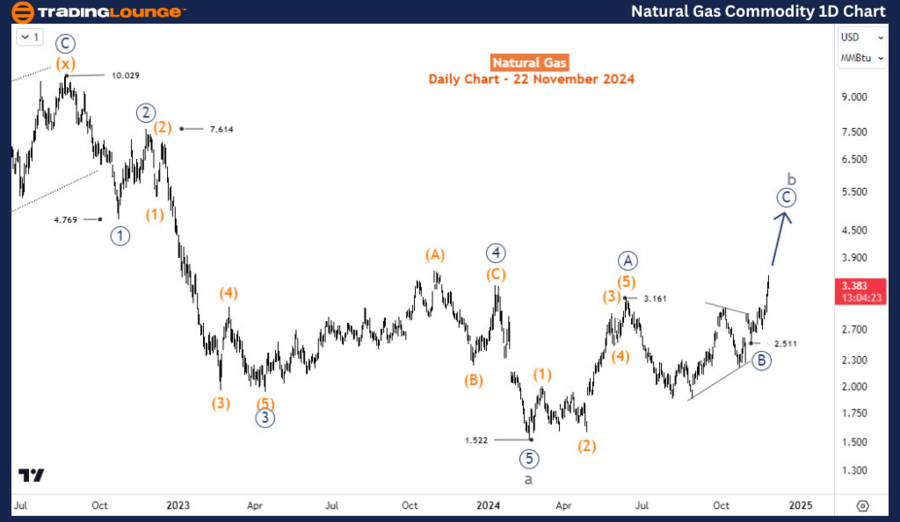
Natural Gas broke upside this week and took the previous high of 11th June. The commodity has gained over 120% since the low of February 2024 and has so far recovered close to half of the massive sell-off that happened between August 2022 and February 2024.
Daily Chart Analysis
On the daily chart, the recovery from the 21 February low of 1.522 is correcting the entire 5-wave decline from 22 August, when the commodity traded for $10, to 21 February when it exchanged for barely $1.5. By Fibonacci projection, this recovery could extend to $3.9-5. The first leg of the correction, wave ((A)) finished with an impulse 5-wave structure at 3.16 on 11th June. The pullback that followed in wave ((B)) ended in a sideways triangle structure. Rally for wave ((C)) began at 2.51 and should extend higher while short-term buyers look for opportunities from pullbacks. Meanwhile, swing sellers can wait for the corrective cycle to finish before engaging.
(Click on image to enlarge)
H4 Chart Analysis
On the H4 chart, wave (1) of ((C)) is emerging and appears incomplete. Price has probably completed wave 3 of (1) and is in a pullback for wave 4 of (1) where fresh bids will push the commodity’s prices higher. The best opportunity will be to look for a corrective pullback in wave (2) and find opportunities to the upside.
(Click on image to enlarge)
More By This Author:
Unlocking ASX Trading Success: Wesfarmers Limited
S&P/ASX 200 Index Elliott Wave Technical Analysis
Elliott Wave Technical Analysis: Dogecoin Crypto Price News - Friday, Nov. 22
Analyst Peter Mathers TradingLounge™ Australian Financial Services Licence - AFSL 317817

.thumb.png.6755e98c0c45b4e653b03ec120284216.png)


