Material Change In A Material World

Image Source: Unsplash
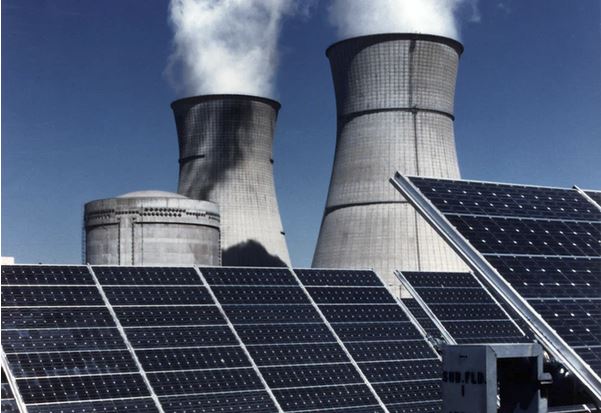
As our climate changes, so do our ways of producing and consuming energy. A global effort is underway to replace fossil fuels with renewables in our energy matrix.1 This planned energy transition’s speed, scope, and scale of impact on the global economy is unparalleled in our history.2 North America’s unique position of contributing nearly 18% of global greenhouse gas emissions, while only housing 5% of the world’s population, puts it under the spotlight. This region of the world is mostly self-reliant for its energy needs derived from carbon-based fuel sources. However, the transition to more renewable energy sources will likely see a higher dependence on the global supply of materials required for a successful energy transition.3
Capturing Relevance from Revenue and Exploration Datasets
To track possible opportunities related to changes in energy production and delivery, we launched the S&P/TSX Energy Transition Materials Index in August 2023. This index provides exposure to North American-listed companies involved in the exploration, mining or manufacturing of materials linked to the energy transition. The index is constructed using input from diverse datapoints—revenue breakdown across various categories from FactSet Revere Business Industry Classification System (RBICS), along with revenue earned, production value and exploration budget segments associated with each of the transition materials for individual companies provided by S&P Global Commodity Insights.
Economics would dictate increased capital spending by mining companies4 on exploration activities to capture the opportunity of rising demand for these transition-related materials. Including the exploration budgets of firms (sourced from S&P Global Commodity Insights) in determining their importance to the energy transition process is a key for a robust index grounded in the economics of supply and demand.
Transition-related materials are very similar to the metals group (aluminum, cobalt, copper, lithium, manganese, molybdenum, nickel, palladium, platinum, silver, rare earth elements and zinc) highlighted in the S&P Global Essential Metals Producers Index, another energy transition-focused index that was launched in August 2023.
The S&P/TSX Energy Transition Materials Index includes all twelve metals covered by the S&P Global Essential Metals Producers Index along with Uranium—which supports a view that nuclear power is a beneficiary of the push toward reduced fossil fuel dependency.5 These thirteen materials are categorized into core and non-core segments. Materials that are expected to see high demand growth specifically from energy transition-related changes are bucketed into core, while the remaining metals fall into the non-core group. The index construction process closely resembles that of the S&P Global Essential Metals Producers Index,6 where an exposure score calculation determines the relevance of each constituent to the theme. There is, however, one important difference.
The S&P/TSX Energy Transition Materials Index also includes companies based on the exploration budget (not just revenue segments) dedicated to these transition materials. Of the current 68 index constituents, 34 constituents (about 28% of the index weight) are included due to their exploration budgets. Of these 34 constituents, 24 do not have tagged revenue segments, underscoring the need for the S&P Global Commodity Insights exploration budget data to complete the index’s well-rounded exposure to the transition metals ecosystem
Index Composition
The index also has a minimum 50 stock count and each stock’s weight is initially set proportional to the product of its float market cap and its corresponding exposure score. Appropriate capping mechanisms are then applied to enhance the liquidity profile and diversification of the index.
The index’s North American-listed requirement puts 60% of the weight in Canadian listings, with the remaining weight in U.S. listings. A GICS® sub-industry breakdown of the constituents highlights the use case for RBICS and S&P Global Commodity Insights datasets to achieve the granularity needed for this index creation. Roughly half of the index exposure to core revenue segments of RBICS is grouped under the GICS sub-industries of Diversified Metals & Mining and Coal & Consumable Fuels.
(Click on image to enlarge)


1 https://www.spglobal.com/en/research-insights/articles/what-is-energy-transition
2 https://www.imf.org/en/Publications/fandd/issues/2022/12/bumps-in-the-energy-transition-yergin
6https://www.spglobal.com/spdji/en/documents/education/education-fueling-the-energy-transition.pdf
More By This Author:
Tracking The Evolving Yield Landscape With IndicesPreviewing The 2024 S&P GSCI Rebalance: Big Oil’s Mojo Is Back
Investigating The Premium Available To Factor Returns Via A Focus On Sustainability
Disclaimer: See the full disclaimer for S&P Dow Jones Indices here.


