
Mastering Mean Reversion: The Power Of Statistical Gravity In Markets

Image Source: Pexels
In today’s increasingly volatile market environment, the ability to identify, measure, and exploit mean reversion opportunities remains one of the most reliable edges available to global macro investors. While markets often evolve, the fundamental principles that drive price normalization and statistical reversion rarely do.
After my last series discussing trends, I wanted to make sure we didn’t get stuck on only one topic. So I’m going to go deeper into mean reversion systems, the opposite of trends, from identification to position sizing to the eventual exit.
First, let’s define what a mean reversion system is. Mean reversion trading systems are based on the principle that asset prices tend to return to their average, or “mean” value, over time. These systems identify when prices have moved abnormally far from their historical averages and take positions anticipating a return to normalcy.
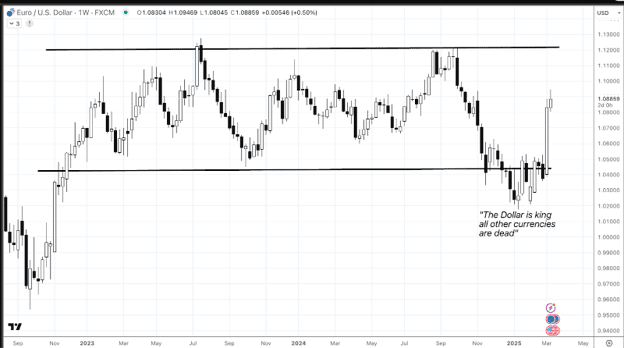
The EUR/USD currency pair is a great example of a market that continues to mean revert, give or take, within the two horizontal lines.

(Click on image to enlarge)
Identifying Mean Reversion: Beyond the Obvious
True mean reversion opportunities are more than just price movements away from averages. They represent statistical anomalies backed by quantifiable measures, such as the following:
- Standard deviation extremes: Genuine reversion setups occur when price moves beyond 2 or 3 standard deviations from established means
- Volume confirmation: Look for diminishing volume as prices reach extremes and increasing volume as prices begin normalizing
- Oscillator divergence: Traditional overbought/oversold indicators create powerful signals when aligned across multiple timeframes
- Sentiment extremes: Excessive optimism or pessimism often marks inflection points ripe for reversion
The most profitable mean reversion trades often occur when conventional wisdom becomes mostly one-sided. By the time financial media identifies a market extreme, smart money is typically already positioning for the reversion.
Let's look back to that EUR/USD chart. Just when the dollar was declared king and all others dead, take a look at the reaction.
(Click on image to enlarge)
Advanced Mean Reversion Identification Techniques
Looking beyond basic price-based signals, sophisticated mean reversion traders incorporate these advanced identifiers:
- Volatility regime analysis: Mean reversion works best in specific volatility environments (neutral, bull volatile, and bear volatile).
- Intermarket correlation divergence: When related assets deviate from established relationships
- Sector relative strength normalization: Sector performance tends to revert to the mean over time
- Statistical arbitrage metrics: Pairs trading and spread normalization based on quantitative measures
The intersection of these signals creates a powerful filter that helps distinguish between structural shifts and temporary dislocations with true reversion potential.
When Dislocations Transform into Opportunities
Market dislocations evolve into actionable mean reversion trades when several conditions align:
- Extreme readings in multiple statistical measures (Z-scores, RSI, Bollinger Bands)
- Price/momentum divergences across timeframes
- Sentiment indicators reaching historical extremes
- Fundamental value metrics supporting mean reversion thesis
This alignment phase offers the optimal risk/reward entry point—after sufficient deviation but before the reversal becomes obvious to the majority.
The Psychology of Mean Reversion
Understanding the psychological phases of market extremes provides critical context:
- Rational phase: Initial price movement away from equilibrium based on legitimate factors
- Momentum phase: Trend followers amplify the move beyond statistical norms
- Emotional phase: The fear of missing out (FOMO) or panic drives prices to unsustainable extremes
- Capitulation: Final surge of irrational positioning before exhaustion
- Reversion: Return toward statistical equilibrium as rational pricing resumes
Monitoring these phases helps you gauge when a market has reached maximum extension and is primed for reversion. The most profitable entry point typically occurs during late-stage emotional extremes—when positioning is maximally one-sided but before reversal catalysts become widely apparent.
Recently, we saw this in natural gas.

(Click on image to enlarge)
Position Sizing: The Probability Paradigm
This is one of the most important parts of any system: position sizing.
Perhaps the most overlooked aspect of successful mean reversion trading is dynamic position sizing based on statistical probabilities. This approach runs counter to conventional thinking but produces superior risk-adjusted returns. And this is where the real opportunity lies.
Larger Positions at Greater Statistical Extremes
When markets reach historically extreme deviations, several mathematical advantages emerge:
- Higher probability outcomes: Statistical principles dictate higher reversion probability at greater extremes
- More precise risk definition: Clear invalidation levels at new extremes
- Enhanced reward-to-risk ratios: Greater mean reversion potential relative to stop distance
- Natural capital preservation: Sizing up only at the most statistically favorable moments
Implementation strategy: Consider allocating up to 1.5-2x your standard risk amount when Z-scores exceed 3.0 and multiple confirmation indicators align, particularly when sentiment measures indicate extreme positioning.

(Click on image to enlarge)
Scaling Into Positions as Extremes Intensify
As markets reach increasingly extended levels, several opportunity-expanding phenomena typically occur:
- Price movement accelerates in the direction of the extreme
- Sentiment becomes increasingly one-sided
- Media coverage reinforces the prevailing narrative
- Contrarian positioning becomes increasingly scarce
Implementation strategy: When statistical measures show progressively greater deviation, consider these scale-in criteria:
- Initial 25% position at 2 standard deviations
- Add 25% at 2.5 standard deviations
- Add 25% at 3 standard deviations
- Final 25% at historical extremes or capitulation signals
This methodical approach—building larger positions as statistical probabilities improve—serves two critical purposes:
- It maximizes capital deployed when mathematical edge is greatest
- It produces a favorable average entry price even if timing isn’t perfect
Statistical-Based Position Sizing
As statistical extremes increase throughout a market dislocation, position size increases proportionally while maintaining consistent risk exposure.
Key Insights
- Direct relationship: As statistical deviation increases, position size increases proportionally
- Consistent risk exposure: Despite the increase in position size, the maximum risk remains constant by adjusting stop placement
- Statistical edge: This approach aligns capital deployment with mathematical probability
- Risk management: Clear invalidation points defined by new price extremes protect capital
The Simple Math of Mean Reversion
Consider the statistical profile of mean reversion returns across various timeframes. Mean reversion win rates tend to increase with statistical extremes, while optimal holding periods are inversely correlated with the magnitude of the extreme. This occurs because:
- More extreme deviations tend to revert more quickly and powerfully
- Less extreme deviations often require more time to normalize
- Risk-adjusted returns peak when positions are sized according to statistical deviation
This data supports the trading wisdom: “The greater the deviation, the greater the opportunity.”

(Click on image to enlarge)
When to Avoid Mean Reversion
Even the most disciplined mean reversion traders recognize environments where this strategy underperforms:
- Strong fundamental regime changes: When underlying economics suggest a genuine paradigm shift
- Structural market disruptions: Major regulatory changes, geopolitical realignments
- Periods of sustained momentum across asset classes: When global capital flows override statistical tendencies
- During liquidity crises: When correlations approach 1.0 and normal market mechanics break down
In these environments, consider rotating capital to trend-following strategies or reducing overall exposure until more favorable conditions emerge.
Mean Reversion Across Different Asset Classes
The mean reversion principles apply universally, but implementation varies significantly across markets. Here are some of my own insights when trading the different asset classes.
Currencies:
- Focus on extreme interest rate differential expectations
- Monitor central bank intervention thresholds
- Pay attention to positioning extremes in COT reports
- Highest probability setups occur after news-driven overreactions
Fixed income:
- Mean reversion works best at yield curve extremes
- Focus on spreads rather than absolute yield levels
- Monitor inflation expectation overshoots
- Real yields provide fundamental anchoring for reversion strategies
Commodities:
- Seasonal patterns create powerful mean reversion opportunities
- Production response times create natural reversion cycles
- Inventory extremes often mark inflection points
- Backwardation/contango extremes signal potential reversals
Equities:
- Sector rotation produces reliable mean reversion cycles
- Individual stocks revert more consistently than indices
- Value factor exposure increases mean reversion reliability
- Mean reversion works best in established trading ranges
Adapting your approach to the specific characteristics of each asset class can significantly improve performance consistency.
Putting It All Together: The Integrated Framework
The most successful global macro investors integrate mean reversion within a broader framework that includes volatility analysis, sentiment monitoring, and position sizing. Rather than viewing mean reversion as a standalone strategy, consider it a lens through which to view potential opportunities.
A comprehensive mean reversion system includes the following:
- Identification: Multi-timeframe statistical confirmation combined with sentiment extremes
- Entry execution: Scaling into positions at optimal deviation levels
- Position sizing: Dynamic allocation based on statistical probabilities
- Risk management: Clear invalidation points defined by new price extremes
- Exit criteria: Predetermined statistical conditions that signal reversion completion
By systematizing each component, you eliminate the emotional biases that typically undermine performance.
More By This Author:
Low Vol Trend To High Volatility Momentum TradingBroadening Tops And Buying Bonds…
Maximizing Momentum For Superior Returns
In the Sunday Setup email that I send out each week, you can see how I use this framework with current macroeconomic conditions targeting emerging mean reversion opportunities across indices, rates, ...
more

