

Image Source: Unsplash
The idea is that today's sale wasn't really about Trump's China tariff announcement.
I've been tracking something more fundamental - the market's internal disorder finally snapping back to efficiency. The risk ratios have been signaling this for weeks.
What We're Actually Seeing…
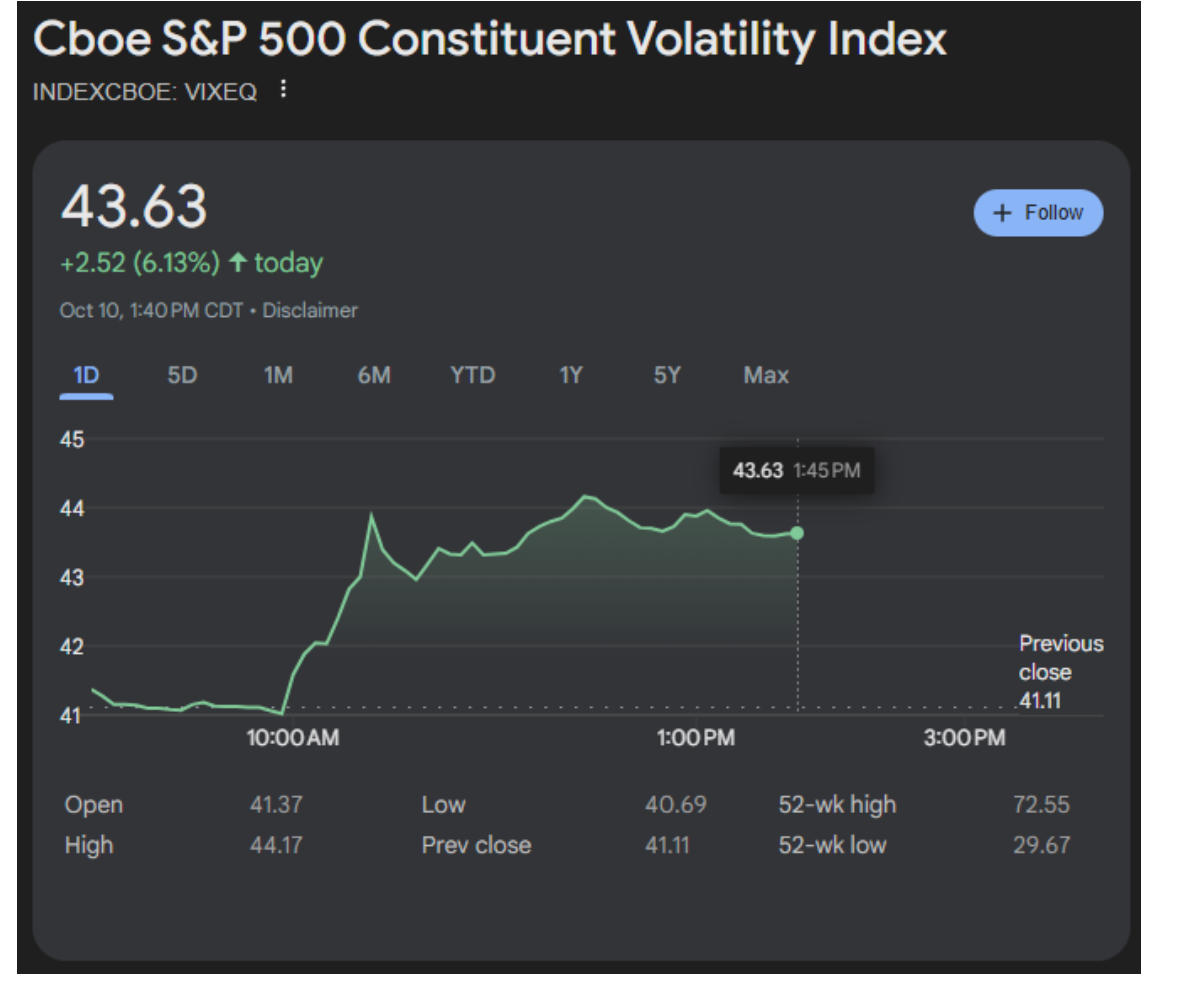
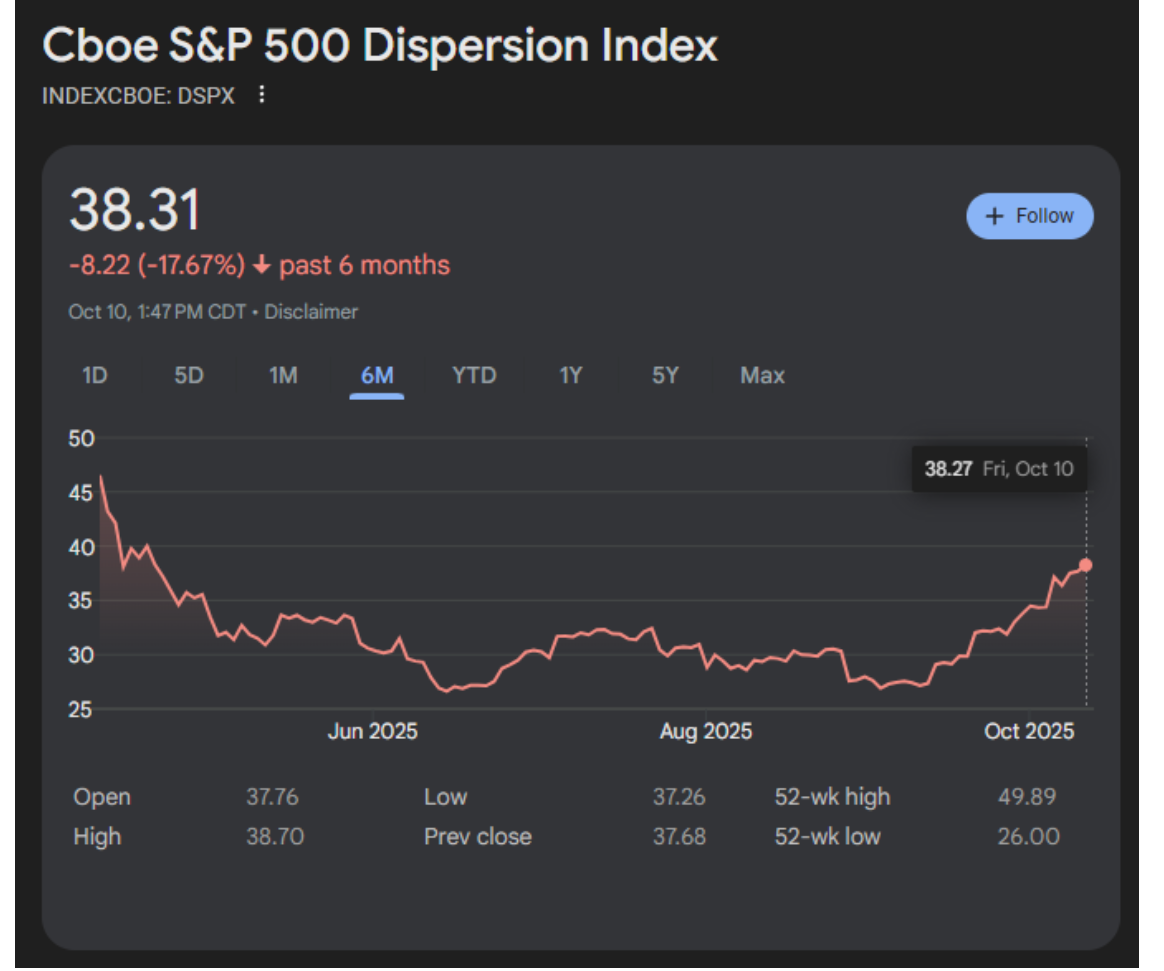
For months now, we've had tremendous inefficiency in the system. VIXEQ - that's constituent volatility - has been trading at extreme levels compared to the VIX. This dispersion can only maintain itself for so long.
The reality is, when we think about entropy in market terms, disorder doesn't get released gradually. The system snaps back to being more efficient, and that's exactly what we're seeing today.
The Risk Ratio Signals
DSPX hit 34 back in July, came down briefly, then surged even higher over the past three weeks. We've been in maximum market entropy territory.
But here's what's more telling - my sector rotation indicators have been breaking one by one:
SPY vs Utilities broke on September 22nd.
That's two weeks ago, we had the signal to sell the S&P and buy utilities.
SPY vs Gold shows we're back to mid-April levels in real terms.
All it takes for the S&P to get back to those April levels is for the dollar to strengthen - it doesn't really require a lot of selling.
The point is, we've had major breaks in corporate credit, major breaks against gold, major breaks against utilities. And utilities have been the best-performing sector in the last 12 weeks.
The Portfolio Reality Check
Now, let's talk about what this means if you're holding the typical high-volatility momentum names. Many of these stocks on my watchlist have 80%, 90%, even 130% implied volatility right now. The VIX is at 20.
So if the S&P drops 5% and these names snap back into correlation with the market, we're talking about 30% declines. If we see a 10% decline in the S&P, we might see 60% drawdowns in these high-vol names.
The reality is, unless you're willing to take substantial drawdown risk, you probably have to have 50% cash if you're invested in these kinds of stocks all the time.
Market Bottom Indicators
We're seeing the first signs, but we're not there yet. Two criteria are met - VIX broke above the 2 ATR Keltner Channel, and the S&P is down more than 1 ATR.
But we're not seeing VIX backwardation yet, and we're not seeing the extreme breadth readings that would signal real capitulation.
The idea is that we might see more downside going into next week. We're finally starting to see order being restored, but it's just the beginning of this process.
What I'm Watching
The volatility expectations have been extreme since mid-July. The market has been pricing in a 5-10% correction for the last two months. We just haven't observed it because retail traders kept putting leveraged money to work.
Regrettably, it would've been much better had we pulled back earlier because it would've allowed us to establish support at a more reasonable point.
But we might see a significant pain point this time around.
The point is, this is not a day to add positions.
This is a day to subtract - take profits, increase cash levels, especially if you're not hedged and especially if you're dominated by high-volatility names.
More By This Author:
The Beginning Of The End For The S&P 500?Why I Buy Highs Instead Of Lows
The Travel Sector Is About To Collapse

Comments
Log in or sign up to join the conversation.