
Major Signals Suggest New Gold Bull Market Coming Soon?
Written by Austrolib
Assuming the fundamental argument of the gold bulls is correct and that:
- a rising dollar supply means rising price inflation,
- a rising price inflation means a rising gold price (and over the last century that is certainly the case)
the question is did we just see a major trend change? What follows are three major signals that we have...[and] that this stage of the gold bull market since 2001 could be the wildest yet.
Signal #1 - 2008 vs. 2016 Bottom
2008
The last time a gold bear market bottomed, albeit a little bitty one by time, was March to October 2008. In that window, gold dropped 34% in 8 months. The climb out of that bear looked like this:
- An initial 22.4% rally over the course of four weeks,
- followed by a cooling off period of 7 weeks (from November 25, 2008 to January 15, 2009) where gold didn't do much of anything on net...[losing just] 4%.
Chart 1
(Click on image to enlarge)

Importantly, the rally was confirmed by gold stocks as measured by the HUI Gold Bugs Index, below. The HUI is followed closely by the Market Vectors Gold Miners ETF (NYSEARCA:GDX):
- The initial spring out of the gate for gold stocks back then brought them 65% higher in those first 4 weeks, outperforming the metal itself by almost 3x,
- followed by more out-performance by gold stocks during the ensuing cooling off period. The HUI still outperformed gold, losing 2.5% versus gold's loss of 4% over the same time period.
Chart 2
(Click on image to enlarge)

The fact that gold miners were outperforming gold both on the way up and on the way down was a good sign the bottom was in. Overall, in that time period, gold stocks outperformed the underlying metal by about 3x.
2016
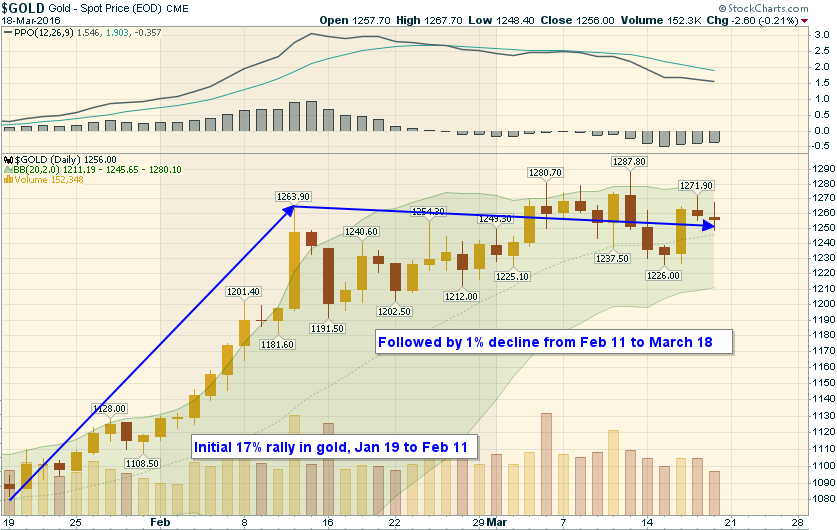
Fast forward to now, and we have the same pattern. Here's gold from January 19th when the HUI last bottomed, to March 18th, 2016:
- We see the same initial rally, this time 17% in 3 weeks,
- followed by a cooling off period of 6 weeks, where gold declines 1% on net.
Chart 3
(Click on image to enlarge)
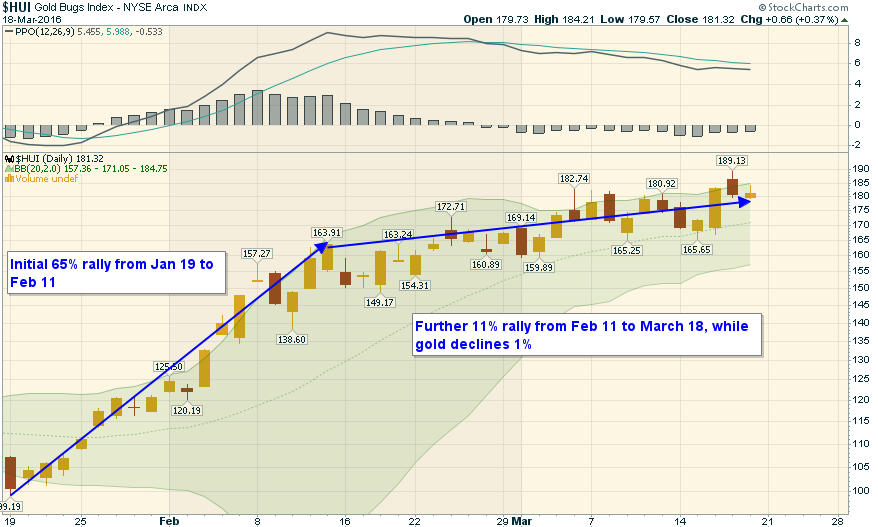
This time again, the rally is being confirmed by gold stocks, this time with even more extreme out-performance both on the way up and the way down:
- From January 19th to February 11th while gold was rallying 17%, the HUI also rallied 65%, outperforming the metal by almost 5x.
- During the ensuing cooling off period while gold fell 1%, the amazing thing is that the HUI actually rallied a further 11%.
Chart 4
(Click on image to enlarge)
Overall, since bottoming, gold stocks have outperformed gold by a factor 5.2x, compared with the 2.9x of 2008.
Signal #2 - A Pattern of Gold Stock Out-performance
The second confirmation is a pattern of gold stocks rising in the face of declining gold on the monthly charts, aside from the 2008 bottom. This happened several times during the gold bull market from 2001 to 2011, but only once during the gold bear, and it was towards the end of it (assuming it is now over).
During the gold bull market:
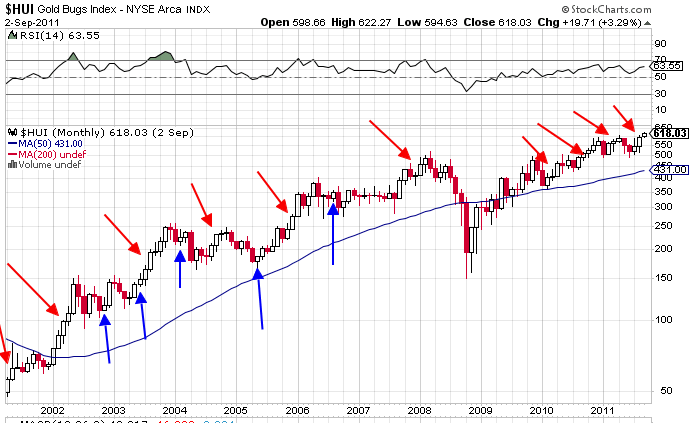
- gold stocks rose in the face of a monthly falling gold price five times, November 2002, June 2003, February 2004, May 2005, and August 2006 (blue arrows on Chart 5 below).
- Each month's out-performance only spelled relatively minor gains, but added up they spelled major out-performance over the course of the bull market.
Chart 5
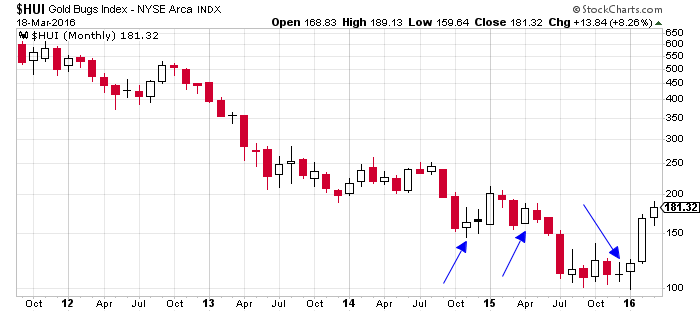
Contrast that with what's happened during the 2011-2016 gold bear market:
- Only twice has the HUI gained in the face of falling gold on a monthly basis since 2011 (see Chart 6 below). The last blue arrow of out-performance is what would be the gold bear market bottom on December 3, 2015 at $1,045.40 if the bottom is in.
- Gold stocks continued declining up to January 19th so there's flexibility with where you want to count the official potential bear market bottom.
Chart 6
Signal #3 - Three Consecutive Monthly Gains
The third signal as it relates to gold stocks that we have reached gold bear market bottom has not been confirmed yet, but it's close. That would-be signal is three consecutive months of gains for the HUI.
Returning to this chart [below] of the HUI during the 2001-2011 bull, but this time focusing on the red arrows, each red arrow shows three consecutive months of gains or more. That happened 10 times during the bull market. How many times during the bear? Look back at Chart 6 [above], and you'll see the answer is zero.
Chart 5 Redux
Keep in mind that there is nothing magical about this specific way of dividing the numbers, looking month to month as opposed to mid-month to mid-month or any other combination that may look different. The point is, for gold bears none of these charts will be convincing. For those who believe in the fundamental premise of being bullish, however, and are expecting a bottom, we are looking at new signs we have not seen since 2011.
Conclusion
Fundamentals
If March closes higher for gold stocks, the third confirmation will be in and, from there, we can go back to fundamentals and say with more confidence that if, indeed, price inflation is headed to 5% or higher, gold prices could quickly fly out of control.
Technicals
The technicals of the bear market appear to be over, and the money supply is still rocketing higher with no end in sigh....Watch out.


