

Image Source: Pixabay
February was a particularly lousy month for the price of COMEX gold, and it came after January ended with many traders and stackers feeling positive and optimistic. Such is the gold market. The more things change, the more they stay the same.
It's hard to believe that just one month ago, COMEX gold had begun the year on a tear. It had moved higher than we'd expected, and the price was closing in on the top of its range and $2000/ounce. What happened next? The same thing often happens. The rug got pulled and, after taking the stairs higher, gold took the elevator down.
On the chart below, be sure to note the big red daily candles of Thursday, February 2, and Friday, February 3. These types of reversal downdrafts are typically how gold rallies end. The Thursday candle came after the FOMC and ECB meetings, and the Friday candle came after the unusually crazy U.S. jobs report.
(Click on image to enlarge)
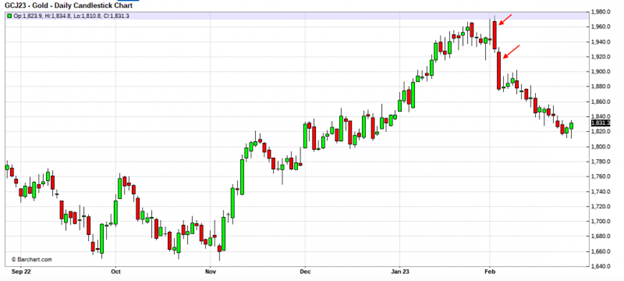
As February progressed, U.S. economic data continued to beat expectations and COMEX gold remained under pressure as the U.S. dollar index rose nearly 4%. The gold price broke its 50-day moving average and proceeded steadily lower.
However, as the month comes to an end, there are reasons to believe that the worst is over. First of all, and as we wrote last week, the first half of 2023 is expected to play out in a manner similar to 2010 and 2019...past years where Fed policy was shifting away from tightening and toward loosening and renewed QE.
As we move forward in 2023, expect the U.S. economic data to worsen toward an obvious recession. This trend could begin as soon as next Friday, the 10th, with the next update on the U.S. employment situation.
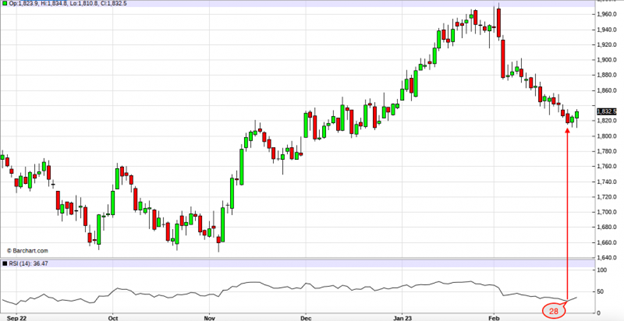
But notice, too, a few other things about the current chart. First, COMEX gold has gotten extremely oversold with a Relative Strength Index that dipped last week to a low of just 28.
(Click on image to enlarge)
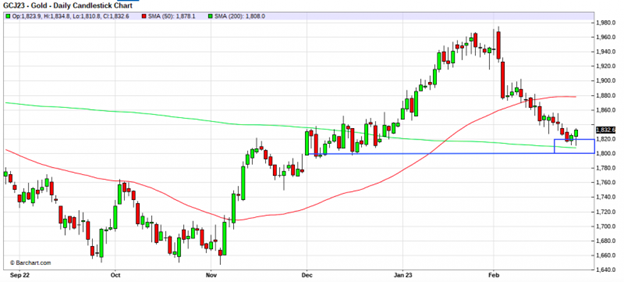
Next, be sure to note that, although COMEX gold broke its 50-day moving average a few weeks ago, the long-term trend of the 200-day moving average has thus far provided support. Gold has found buying support above the psychologically important $1800 level too.
(Click on image to enlarge)
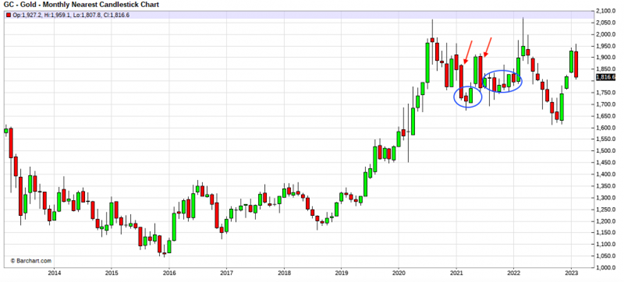
Finally, while the price has been generally moving sideways and consolidating since mid-2020, there have been other months that have actually been worse. For example, both February and July of 2021 saw monthly declines well in excess of $100. See below:
(Click on image to enlarge)
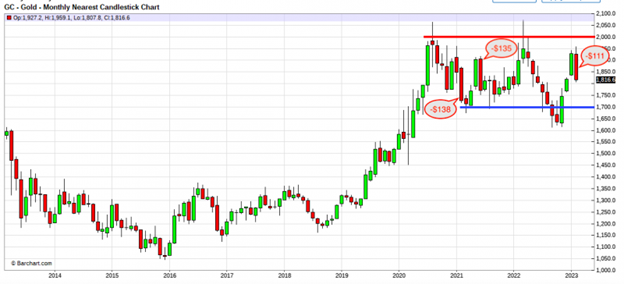
But now look at that chart again and be sure to notice what type of price action followed in February and July of 2021. Did the price continue sharply lower or did it slowly ease back higher within the overall range?
(Click on image to enlarge)
In conclusion: Yes, February was terrible and no fun at all. However, the U.S. is still barreling toward a recession as the lagging effects of 2022's unprecedented Fed rate hike scheme eventually take hold. Though the COMEX gold price will continue to frustrate for a few more months, those willing to remain focused on The Big Picture for 2023 and beyond will eventually be rewarded.
More By This Author:
Big, Big, Big Things Happening” In Gold And Silver - Yearly Wrap UpJuly Ends Better Than It Began
How To Think Clearly In A Volatile Precious Metals Market

Comments
Log in or sign up to join the conversation.