

Image Source: Pixabay
‘Valuations are for losers. Have fun staying poor, Denning. And have a great weekend in Laradise, wherever that is!’
That’s friendship in the age of social media. You should see the direct messages I get from total strangers. When it comes from an old friend, you have to take it in the spirit with which it’s offered, which is mostly good-natured.
Besides, when you’ve been through boom and bust cycles, you begin to recognize the psychological signs of excess. Euphoria for sure. But also a bit of arrogance. And braggadocio. It’s all in good fun–and my friend has clearly not been keeping up with the performance of precious metals this year.
But since it is, in fact, a beautiful and sunny autumn day here in ‘Laradise,’ I’ll cut him some slack. With US stocks at all-time highs, it’s a good time to look at what MAY be different this cycle. Everything is bigger…and the stakes are much higher. This week we’ll focus on leverage and loathing. Leverage first.
READER QUESTION: If you are so sure the market is in a bubble, why not short it?
MY ANSWER: We ARE short stocks, in the form of a 40% allocation to cash and 39% allocation to precious metals and durable assets. You raise a good point, though, and one we have to remember. Cash IS an investment position. And it’s not risk-free, either.
We think we can earn a modest yield on cash or cash-like deposits (short-term Treasuries) while staying in a liquid asset. This liquidity gives us what the eggheads call ‘optionality’--the ability to spend that cash on something else if and when there is compelling value or some imminent upside ahead (to the extent you can predict imminent catalysts for an asset).
But the main point of being in Maximum Safety Mode is not to make money when stocks go down. It’s to avoid losing it. And trying to short the market by timing the decline is a sure way to lose it. What’s worse, a lot of people are trying to leverage the market in BOTH directions to make more money even faster.
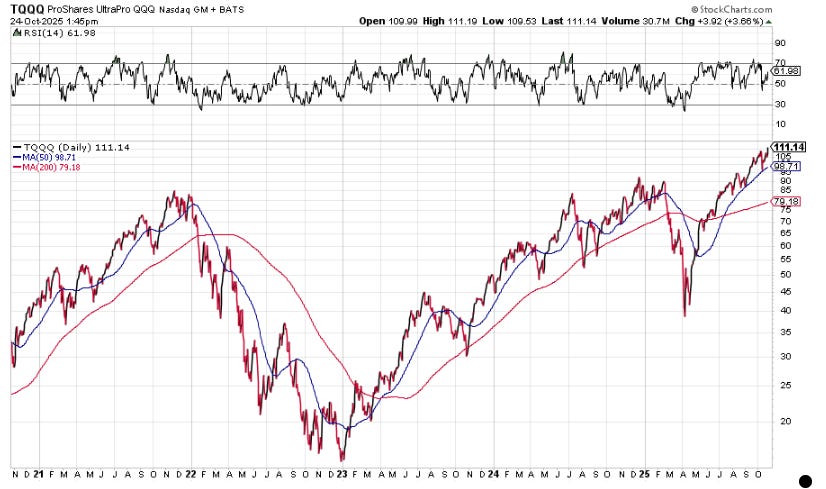
That’s why I included the first chart above. It’s the ProShares UltraPro QQQ [TQQQ] exchange-traded fund (ETF). It has $24.5 billion in assets under management. That makes it the largest single leveraged ETF trading on the market (currently trading at an all-time high). But by no means is it the ONLY leveraged ETF.
There are now 701 leveraged ETFs listed on US exchanges. That’s doubled in three years, with 200 alone added this year. Between 60% and 70% of those leveraged ETFs are ‘long,’ typically aiming to 2x or 3x the return of an underlying index or basket of securities.
Lesson? So much for ‘stocks for the long run.’ Ain’t nobody got time for that. No one wants to compound quality stocks over time. The long-term is too long for today’s investors. Give me everything and give it to me right now.
When I first started looking for indicators of excessive leverage in the market, the main one was margin debt in brokerage accounts. That one is still important. And just this week, it also hit a new all-time high of $1.13 trillion.
It’s inched higher for five months in a row. This is a conventional way to speculate by borrowing against the value of your securities. The speculation ends with a margin call, when you have to sell whatever’s liquid to make up for losses on your bad bets.
I suspect the collapse in leveraged ETFs, which will inevitably come, will be ugly and swift. These products aren’t stress tested to perform in markets with much lower liquidity and sudden changes in asset values. Easy come. Easy go. Gurgle gurgle down the drain.
Leveraged ETFs of all stripes (stocks, bonds, long, short, etc.) have about $218 billion in assets under management. The combined market value of unleveraged gold ETFs like XAU, GDX, and GDXJ is roughly $87 billion. Gold mining stocks are under-owned and under-invested in. We’ll have more on that–including questions directed at Tom Dyson - in the November Monthly Strategy Report, due out next Wednesday.
When we use the word ‘financialization’ of the American economy, this is what we mean. Americans have become a nation of speculators and gamblers whose main occupation is betting on everything. When Napoleon said England was ‘a nation of shopkeepers,’ he meant it as a compliment. The British earned their wealth through commerce. In today’s America, we’re a nation of gamblers. That is not a compliment.
Stocks, NBA games, you name it, you can bet on it. For the wealthy who own assets, the speculation is financial. For wage earners who don’t own financial assets, it’s Fan Duel, Draft Kings, Sports Bet, and the many other smartphone-based gambling apps whose advertisements are ubiquitous on TV.
You also have prediction markets like Kalshi and Polymarket. There, you can bet on the probability of real-world events and outcomes. For example, you can bet on whether Jerome Powell’s first words at his 2:30 pm post-FOMC press conference will be ‘Good Afternoon’.
By the way, there’s not a lot of juice in that bet. Powell says exactly that almost every time he begins a press conference. The three lowest probability bets for which there is a market on Kalshi for words Powell might use are ‘Fort Knox,’ ‘Egg,’ and ‘National Debt.’ Those are asymmetric bets that might be fun to make if you had nothing better to do and money to gamble.
READER QUESTION: The US current debt-to-GDP is 123% — 130% is the tipping point. So, how does Japan survive with a much higher debt-to-GDP Ratio?
MY ANSWER: Great question, and one I could nerd out to at length. But the short answer has three parts. First, 87% of Japan’s debt is domestically financed. It doesn’t rely on foreigners, who are influenced by both interest rates and currency risk.
Second, the Bank of Japan owns 50% of that debt, which makes it essentially non-marketable. They don’t have to sell it, either, or mark it to market. The BOJ also practices yield curve control on the 10-year Japanese government bond. In other words, capping interest rates makes the debt servicing cost more manageable.
But the third and most important factor is that Japan is a net creditor nation. Its net international investment position is positive. In simple terms, that means the value of Japanese investment overseas exceeds the value of foreigners’ investments in Japan (this might be somewhat problematic in that Japan owns a $1 trillion worth of US government bonds, which count as an asset in its NIIP, but we will leave a potential loss on those assets for a future discussion).
Without trying your patience on a Friday afternoon, the bottom line is that Japan trades with the rest of the world at a surplus, produces high quality manufactured goods, has a high savings rate, finances its own deficits and most of its debt out of domestic savings, and has been at the forefront of using quantitative easing and yield curve control to support its debt (and equity) markets. What about the US? Check out the chart below
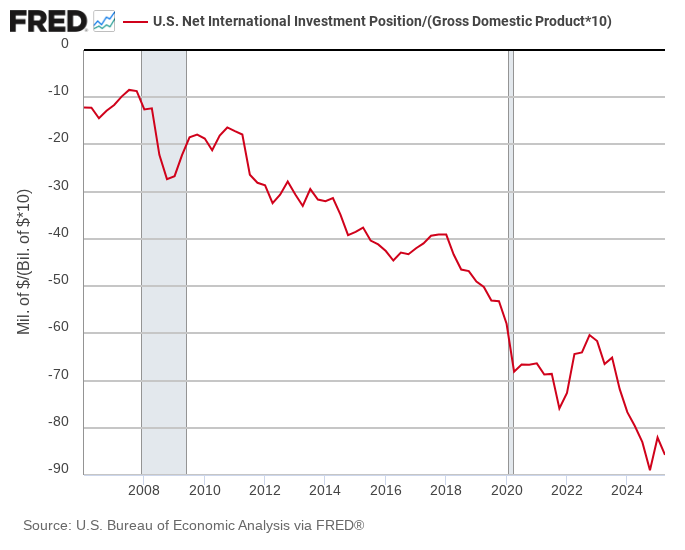
The net international investment position for the US was negative $26.14 trillion at the end of the second quarter (assets of $39.56 vs. liabilities of $65.71). That’s about 85% of US GDP, as the chart above shows. They (the rest of the world) own more of us than we own of them. And yes, there is a bright side to this. What is it?
US stocks and bonds have been attractive and popular to foreign investors for almost four decades. We have the biggest and most valuable tech companies in the world. Our government bond market is the deepest and most liquid. Our capital markets are open to foreigners, and there is a lot to choose from.
That’s why they come shopping here–especially since the performance of US financial assets relative to Europe, Japan, and Emerging Markets has been backed by very accommodating interest rate and balance sheet policy from the Fed.
But there’s another, darker point. The business of America is no longer business. The business of America is keeping the market value of its business increasing forever, lest they deflate and crash.
The 130% debt-to-GDP ratio is a problem for America, while 230% is not a problem for Japan, because America is a debtor nation. A fall in the value of the dollar makes US assets less attractive. A fall in the value of US assets makes the dollar less necessary. It’s a doom loop. The only way to avoid it is to keep stocks elevated at a permanently high plateau.
On the fiscal side, the US government added $1 trillion to the national debt in just 71 days—from $37 trillion to $38 trillion in a matter of months. The interest cost on that doubt is mounting. And none of this includes the cost of unfunded future liabilities, which are so large and grotesque that they can only realistically be paid off through a massive devaluation of the dollar.
Normally, massive macro measures like net international investment position are not something you have to think about, much less can you do anything to change. The important point here is that the US relies on foreign capital to finance its deficits, is already a net debtor, and has an increasingly dysfunctional federal government where the rule of law cannot now be taken for granted, nor, perhaps, the future repayment of debts.
From a more practical, real-world point of view, the US runs regular trade and current account deficits. Foreigners still want our financial assets–which is a good thing, because we’re really good at creating new ones to sell them all the time. But having become a nation of paper pushers and gamblers, our debt levels relative to real economic output are not sustainable.
The current administration knows all this. But it seems to have bet on growing its way out of the debt problem. It hopes a combination of cheap energy, deregulation, a weaker dollar, higher wages through massive deportation of illegal immigrants, and bi-later trade deals will increase exports and goose GDP fast enough to generate jobs and tax revenues which reduce the deficit (in nominal terms and as a percentage of GDP).
Big problem. There’s been no reduction in spending. A Republican Congress and a Republican President have made no serious attempt to slow the rate of government spending, much less reduce it in absolute terms. Without that, the above growth measures–even if they could pull them off–are not enough to keep the debt-to-GDP ratio from climbing to the level (130%) where you have either a currency crisis or a bond market default.
Tick tock, Mr Tump. Tick tock.
READER QUESTION: Please discuss the interplay between the price of gold and gold equities. My concern is that, yes, gold is going up but so is the stock market, and at some point the stock market will correct, crash, etc. Notwithstanding that the gold price has increased and most likely will continue to increase, won’t gold equities be sold, too, if there’s a crash or significant correction? My point is that a crash/correction may decimate my gold equities position even though the price of gold stays firm or goes up. I like gold equities BUT I’m very nervous about the stock market. Your thoughts and ideas, please.
MY ANSWER: Another great question. I’m going to totally punt on it and send it to Tom for next week. Not because I have no answer. But it’s a more tactical question, better suited for the Investment Director rather than Research Director. I would say that in a bear market in stocks–should the authorities ever let one happen again–is bearish for all stocks, including mining stocks. Your hope, with some encouragement from history, is that producers (and exporters) of real assets do relatively better that the biggest and most widely held losers (tech).
Quietly, while almost no one was watching (or caring) the oil price hit a five-year low earlier this week. That prompted Bill to ask me how our Trade of the Decade was going. And now the week ends with the Dow, the Nasdaq, and the S&P 500 all making new all-time highs on a ‘soft’ CPI report.
As I noted earlier today, both core and headline CPI are at 3% over the last twelve months. And that’s with low energy prices. Higher energy prices–for any reason at all–coupled with lower interest rates and the end of QT by the Fed are setting the stage for another wave of inflation in 2026. The policy makers are going to run the economy as HOT as they can, with the Fed pivoting toward full employment over low inflation.
Gold knew this months ago, which is why it has clobbered the S&P 500 this year (gold’s up 56% year-to-date, silver 65%, and the S&P 500 15.4%). What’s different this cycle is how badly oil has lagged, at least as an inflation hedge. GDP growth (minus capex on AI) is more tepid than the official numbers show (our Doom Index confirms this in the reading we’ll publish next month). But does this change anything with regard to the Trade of the Decade?
No.
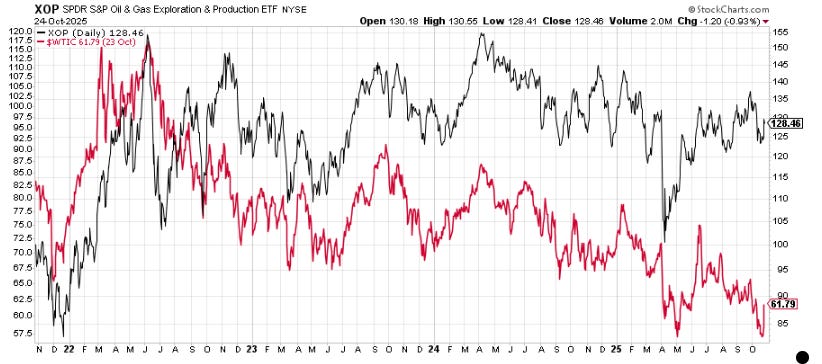
The chart above shows XOP–our vehicle for the Trade–in black. West Texas Intermediate crude is the red line. You can see that almost all of the initial gain in the Trade of the Decade came in the first year. We’ve been trading in a range since then–and that’s while the oil price has languished.
It’s kind of surprising that XOP has held its ground. But then, with oil and energy producers making up less than 3% of the market value of the S&P 500, how much lower CAN they go? Well, if oil (for some reason)went below $40, then the producers WOULD go lower. But I don’t think that’s going to happen. Why?
One, production in the Permian Basin is plateauing. The ‘shale gale’ isn’t all blown out–you’d not want to underestimate the resourcefulness of the Texas drillers. But geology is geology. And on that score, growth in supply is slowing around the globe.
Two, all these new mining and critical mineral projects the US government is becoming a shareholder in will take energy to develop. So will building all the new data centers. And all the power plants (nuclear or otherwise) required by the data centers. There’s demand growth here.
Finally, and maybe a bit more analytically, oil is both hated and ignored. It’s like gold was in the late 1990s, before the bottom in 2002. And then things shifted.
Some readers might be tempted to ditch XOP for a trade in silver or critical minerals. Good luck to you! But we wouldn’t recommend it.
It’s understandable if you feel your capital is deployed in a position treading water and you can do better. But please remember that with correct position sizing, the Trade of the Decade should be just one of at least a dozen positions you’re tracking on the Official List. You shouldn’t have a massive amount of capital tied up in just one trade to begin with, especially since we only have a 20% allocation to stocks at the moment.
But the time period here is the real key. If you think you’ll need the money in twelve months, or if you’re the type of person that has to be always doing something and taking action, making a ten-year trade can be tough psychologically. But that’s kind of the point.
If we’re right about the underlying dynamics, you don’t have to do anything with the Trade of the Decade. You make it and forget it. If you’re looking for a good price to enter it for the first time, keep your eyes on this space. Both Tom and I regularly look for new entry points.
The exit will come in five years or so, when the energy sector is a much larger percentage of the S&P 500. And likely, oil prices will be much higher.
Who knows what the world will look like then? We don’t. But from a physics point of view, we’re betting that energy will be more valuable and still relatively scarce. And more loved than loathed.
More By This Author:
Why Gold Is Going Up?Here Comes Trouble
Long Haul Gold


Comments
Log in or sign up to join the conversation.