
It’s The USDX’s Déjà Vu Moment
It’s uncanny how the USDX is mirroring its moves back in 2017-2018. This remarkably similar pattern proves that once in the elevator, the dollar is going up.
Gold, meanwhile, is experiencing a corrective moment amidst a bigger downswing, while the miners are undergoing a decline on bigger volume than they had during last week’s correction. The signals remain bearish for the precious metals.
In yesterday’s flagship Gold & Silver Trading Alert, I emphasized that the next short-term top had most likely already formed last Thursday (Apr. 8). The basis for this was the triangle-vertex-based reversal in gold as well as the USD’s correction that appears to be analogous to its 2018 correction that was followed by another powerful rally.
In short, the above expectation (and reasoning behind it) remains up-to-date. Let’s start today’s discussion with a look at the USD Index.
The USD Index
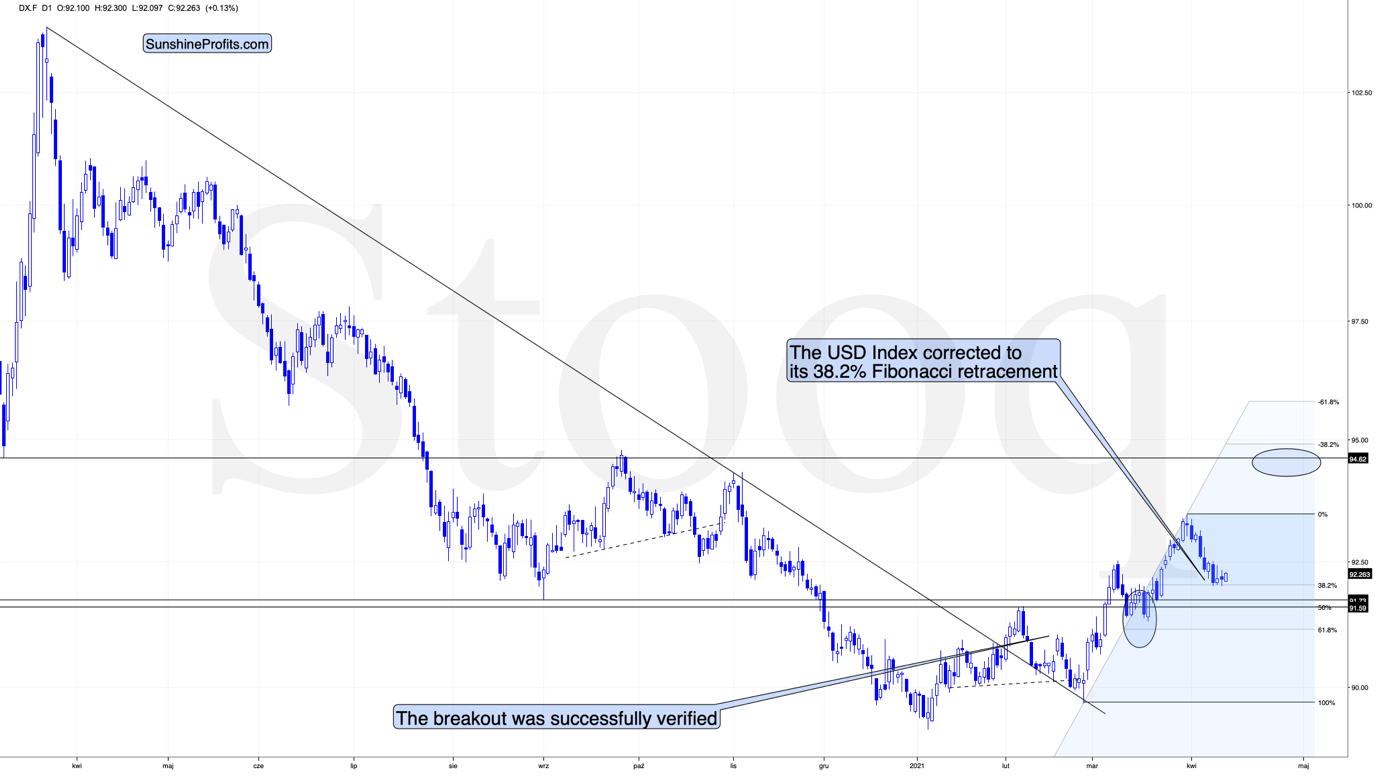
In short, the USD Index is trading sideways after moving to its mid-2020 lows and to its 38.2% Fibonacci retracement level. This combination of support levels has likely created a bottom in the USD Index, but that’s not the only factor that needs to be considered. The other – very important factor – is the continuous similarity in the USDX to how it rallied in 2018 after a very similar yearly decline. I wrote about it previously, and these comments remain up-to-date.
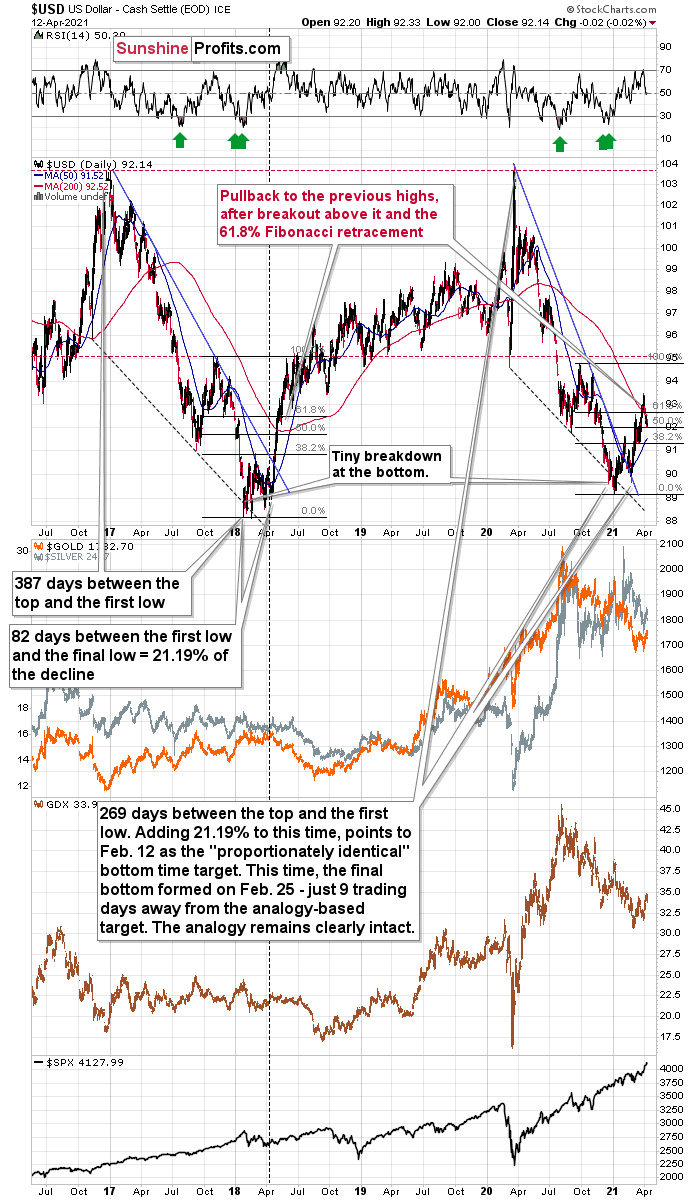
The similarity between two declines (2017-2018 and 2020-2021) is so big that it’s almost useless to describe it. Almost identical starting points, extremely similar ending points, and a very similar correction after the first half of the decline. The recent decline was a bit shorter, but otherwise, both price moves are almost identical.
In both cases, the declines have ended below 90 and the final confirmation came when the USD Index rallied above both: its declining blue resistance line, and the 50-day moving average, which is also marked in blue. There was also – in both cases – a pullback after the USD Index soared above its 200-day moving average that I marked in red. That’s the “you are here” point on the roadmap.
What’s next? Most likely another sharp short-term upswing.
Given the magnitude of the 2017-2018 upswing, ~94.5 is likely the USD Index’s first stop. And in the months to follow, the USDX will likely exceed 100 at some point over the medium or long term.
Keep in mind though: as far as the fundamentals of different currencies are concerned, we’re not bullish the greenback because of the U.S.’s absolute outperformance. It’s because the region is doing (and likely to do) better than the Eurozone and Japan, and it’s this relative outperformance that matters, not the strength of just one single country or monetary area. After all, the USD Index is a weighted average of currency exchange rates, and the latter move on a relative basis.
If the USD Index is practically done correcting, then the rally in the precious metals is also over, and that’s exactly what the charts are saying.
Gold
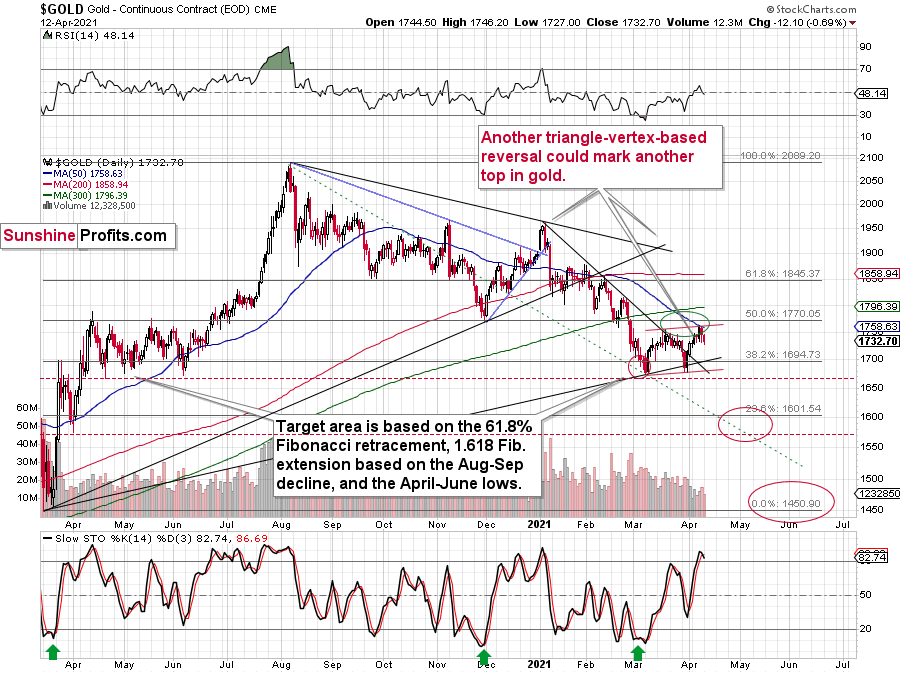
Gold topped right at its triangle-vertex-based reversal, just like it did in mid-March and in early January (please note the points that are marked on the above chart for confirmation – they are described in red). That happened on Thursday (Apr. 8), and since that time gold continue to move lower (also during today’s pre-market trading).
Gold invalidated the breakout above its mid-March highs, proving that what we saw was nothing more than just an ABC (zigzag) correction within a bigger downswing. The moves that follow such corrections are likely to be similar to the moves that precede it. In this case, the move that preceded the correction was the 2021 decline of over $150. This means that another $150+ decline could have just begun.
Miners: GDX and GDXJ ETFs
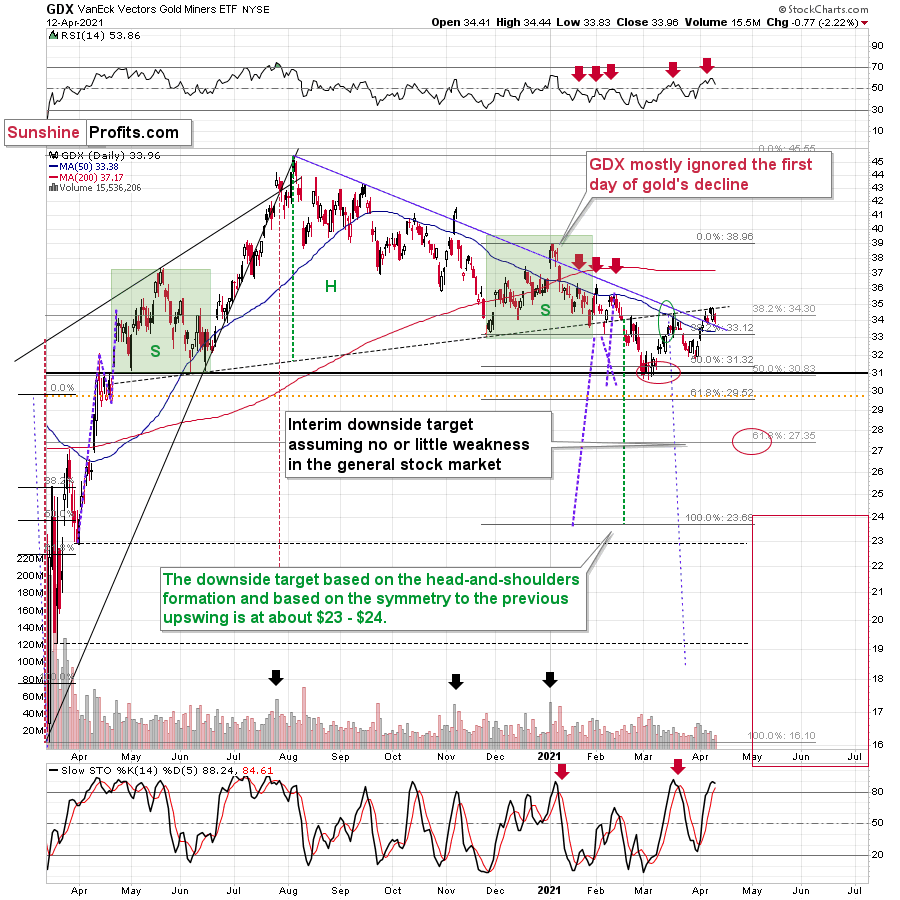
Just like the GDX ETF invalidated the breakout above its mid-March highs, it once again verified the breakdown below the broad head-and-shoulders pattern. Also, please note that the volume that accompanied yesterday’s (Apr. 12) decline was bigger than that which accompanied Friday’s (Apr. 9) intraday rally.
The implications are bearish, and we can say the same about the implications of the situation in the GDXJ chart.
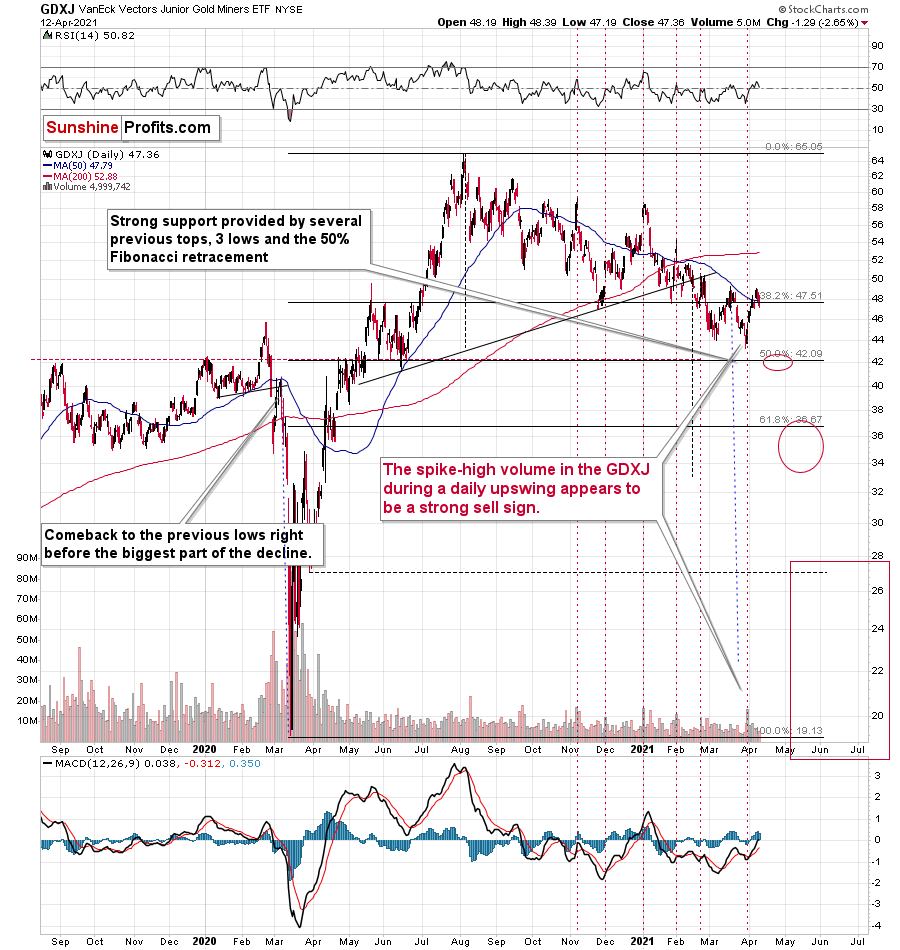
In this case, we even saw the invalidation of the breakout above the 50-day moving average.
Even more interesting is that the GDXJ to gold ratio that I described previously, has just invalidated its small breakout above its declining resistance line.
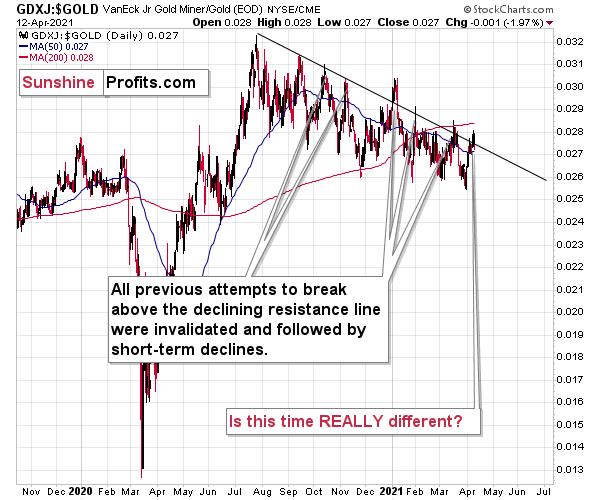
Yesterday, I commented on the above in the following way:
The breakout in the GDXJ to gold ratio is only tiny and unconfirmed. These moves always (since Oct. 2020) provided sell signals – the small breakouts below the declining resistance line were always invalidated and they were then followed by visible short-term declines.
Five out of five previous attempts to break above the declining resistance line failed and were followed by short-term declines. Is this time really different?
It seems to me that the five out of five efficiency in the GDXJ to gold ratio is more important than a single breakout in the GDX to gold ratio, especially considering that the latter was preceded by a similar breakout in mid-March. That breakout failed and was followed by declines.
The implications of yesterday’s invalidation of the breakout in the ratio are clearly bearish.
Disclaimer: All essays, research, and information found above represent analyses and opinions of Matthew Levy, CFA and Sunshine Profits' associates only. As such, it may prove wrong and be ...
more


Thank you, comprehensive and impressive analysis, as always!
Thanks for following my analyses and for the feedback, I appreciate it
Yeah right The fact that M2 is not updated the same way must surely be extremely bullish for the dollar Lol!!
I'm not commenting on M2 in this article at all. That's a bearish factor, of course. Not something that's likely to move the market in the short run (more than it already did), though. Also, it doesn't change the picture for the Eurozone or Japan and let's keep in mind that the USD Index and currency exchange rates move on a relative basis. In other words, out of all the ugly things (fiat currencies), the USD might still be one of the best looking ones.