
Is Post-Fed Rally In Gold, A Bull Trap?
Gold dropped to a low of $1195.13 on March 10 and traded sideways ahead of the Fed rate decision before jumping to a high of $1233.73 levels on a dovish Fed hike.
Meanwhile, the 10-year treasury yield clocked a high of 2.632% on Mar 13 before falling to 2.482% today. At the short-end of the curve, the 2-year yield witnessed a similar move. It clocked a high of 1.403% yesterday before falling to 1.283%.
Two rate hikes in three months
The sharp drop in the treasury yields (rise in prices) at least in part represents the fact that many in the markets were expecting the Fed to sequential rate hikes i.e. four rate hikes every year. However, sequential rate hikes is a distant dream, given the fact that wage growth is still anemic. Trump’s fiscal plan is not seen coming through before August/September.
Fed kept the rate hike outlook unchanged for 2017 and 2018. The central bank sees potential for three rate hikes this year and next year. That disappointed hawks and was partly responsible for the sharp drop in the treasury yields. But one must not forget the fact that Fed has delivered two rate hikes in three months, which suggests the central bank, is less likely to back away from two more rate hikes in 2017 and may even consider raising rates at a faster rate if Trump’s fiscal plan meets market expectations.
Hence, the sell-off in the treasury yields could be short lived. Moreover, the drop in the treasury yields (rally in prices) and the rally in gold mainly represented “Buy the fact” trade.
Treasury yields have held on to crucial support levels
Daily chart - 2-year treasury yield - Former support acting as a support
(Click on image to enlarge)
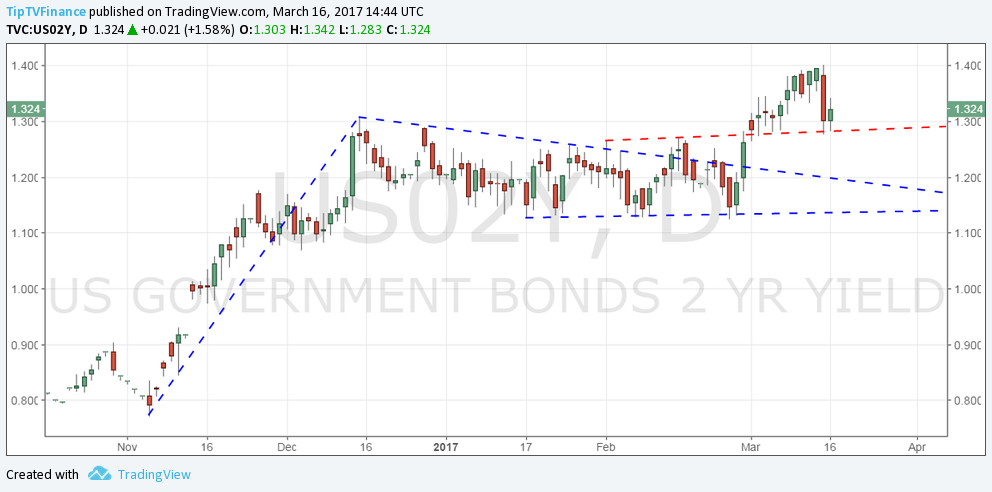
- The yield found support at 1.28% (former channel resistance) yesterday and has staged a rebound to 1.33%.
- The major averages - 50-DMA, 100-DMA and 200-MA are all sloping upwards and nicely aligned (one below the other) suggesting the long-run view remains bullish.
Daily chart - 10-year treasury yield - Bullish pattern intact
(Click on image to enlarge)
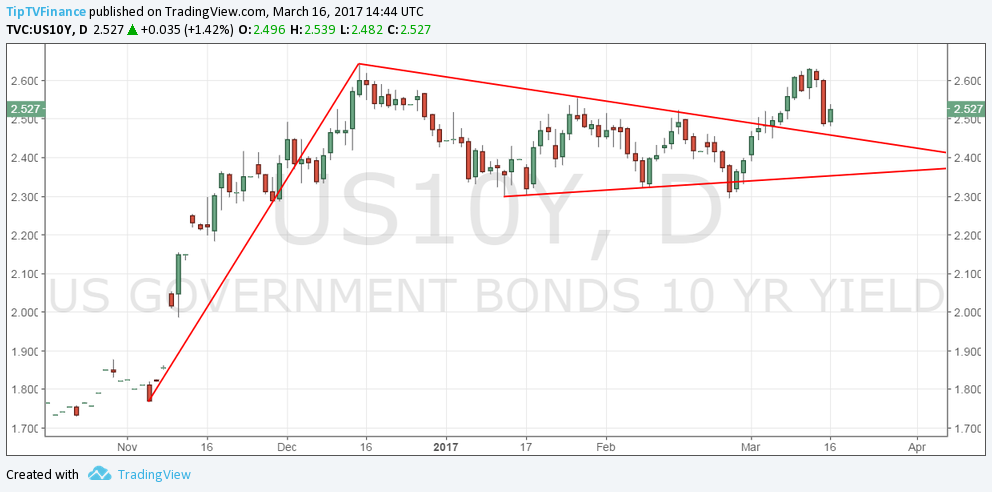
- The major averages - 50-DMA, 100-DMA and 200-MA are all sloping upwards and nicely aligned (one below the other) suggesting the long-run view remains bullish.
- Bullish invalidation is seen only if the yield closes back inside the triangle formation.
Bull trap in gold?
The negative correlation between gold and treasury yields is well known.
The Fed situation explained earlier, coupled with the fact that the treasury yields are still looking bullish on the charts suggests the rise in the yellow metal could be a bull trap…
A bull trap would be confirmed if either the 10-year or 2-year, or both yields break above the recent highs.
Gold daily chart - Potential head and shoulder formation
(Click on image to enlarge)
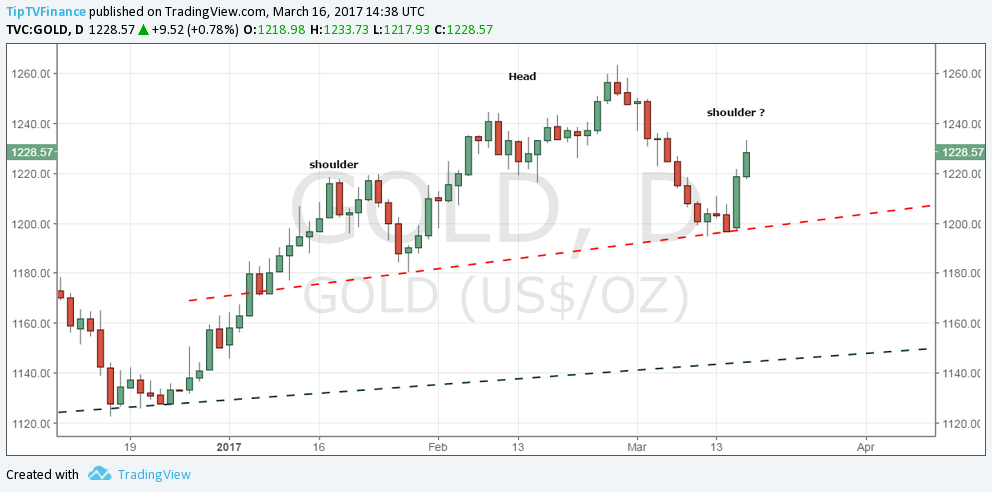
- A potential head and shoulder formation with the neckline around $1200 cannot be ruled out if the treasury yields break above their recent highs. As mentioned earlier, a break higher in the treasury yields would confirm a bull trap in gold.
Monthly chart - Bearish view intact
(Click on image to enlarge)
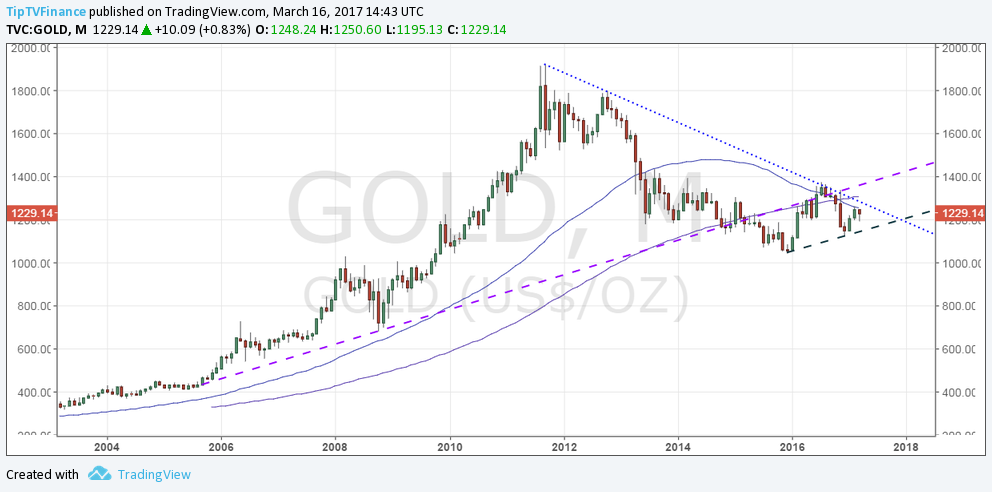
- The outlook remains bearish as long as the descending trending coming from 2011 high and 2012 high remains intact.
- Furthermore, the 50-MA has topped out and we also have a bearish 50-MA & 200-MA crossover.
Disclosure: None.


