

Image Source: Pixabay
The silver price has broken $40+ over the past few trading days - the first time in 14 years - so there is understandably quite a bit of relief and cautious optimism as long-time holders let out a deep breath. For those who are perhaps now just approaching break-even or a marginal gain on purchases made a decade+plus ago, there is undoubtedly a strong temptation to sell their holdings and lock in a bit of profit.
I, on the other hand, think silver may just be getting started. This week's ratio charts of silver vs. the big banks makes a strong case as to why.
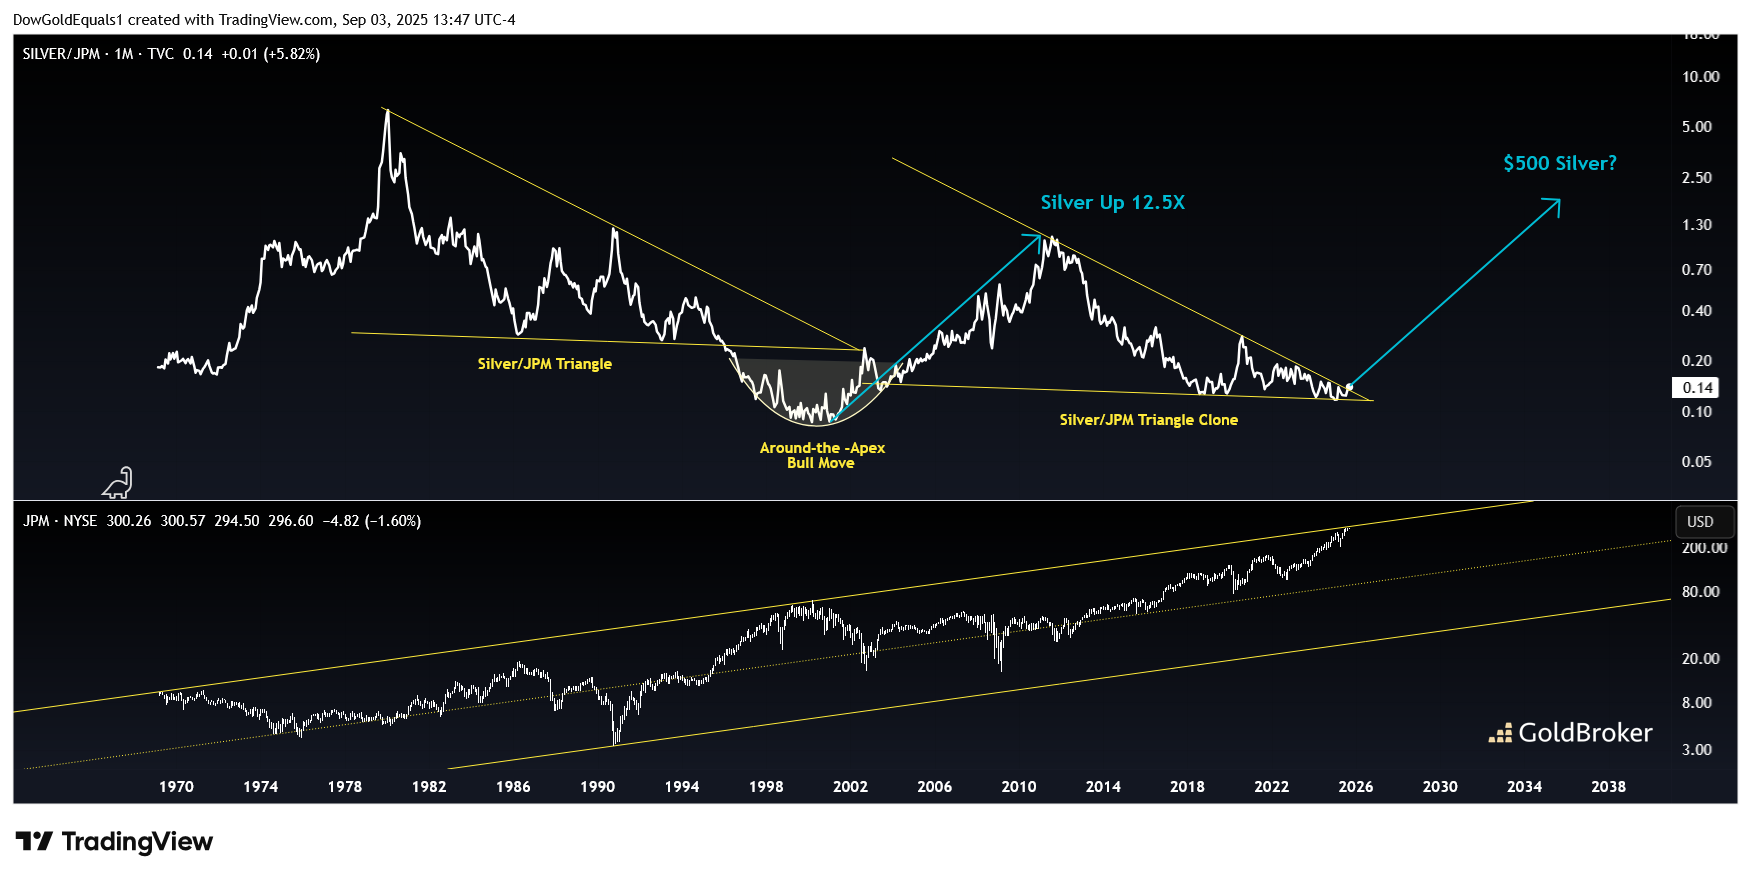
The first is a combo chart with Silver/JPM on top and JPM on the bottom.
On the top chart, note that the two triangles are exact clones. While price dropped out of the first triangle, requiring an around-the-apex move to launch a silver bull, the current triangle has seen price float deep into its apex and may even be breaking out now.
While not marked, you can also see a pretty good double bottom within the current triangle. Should the ratio break out and launch a move similar to the one that began in 2001, silver would reach the $500 area.
Finally, note the bottom chart of JPM and how its current price is right on the upper rail of its ascending channel. The last two times that rail was touched was in 1970 and 2000, pretty good times to be buying silver and dumping JPM.
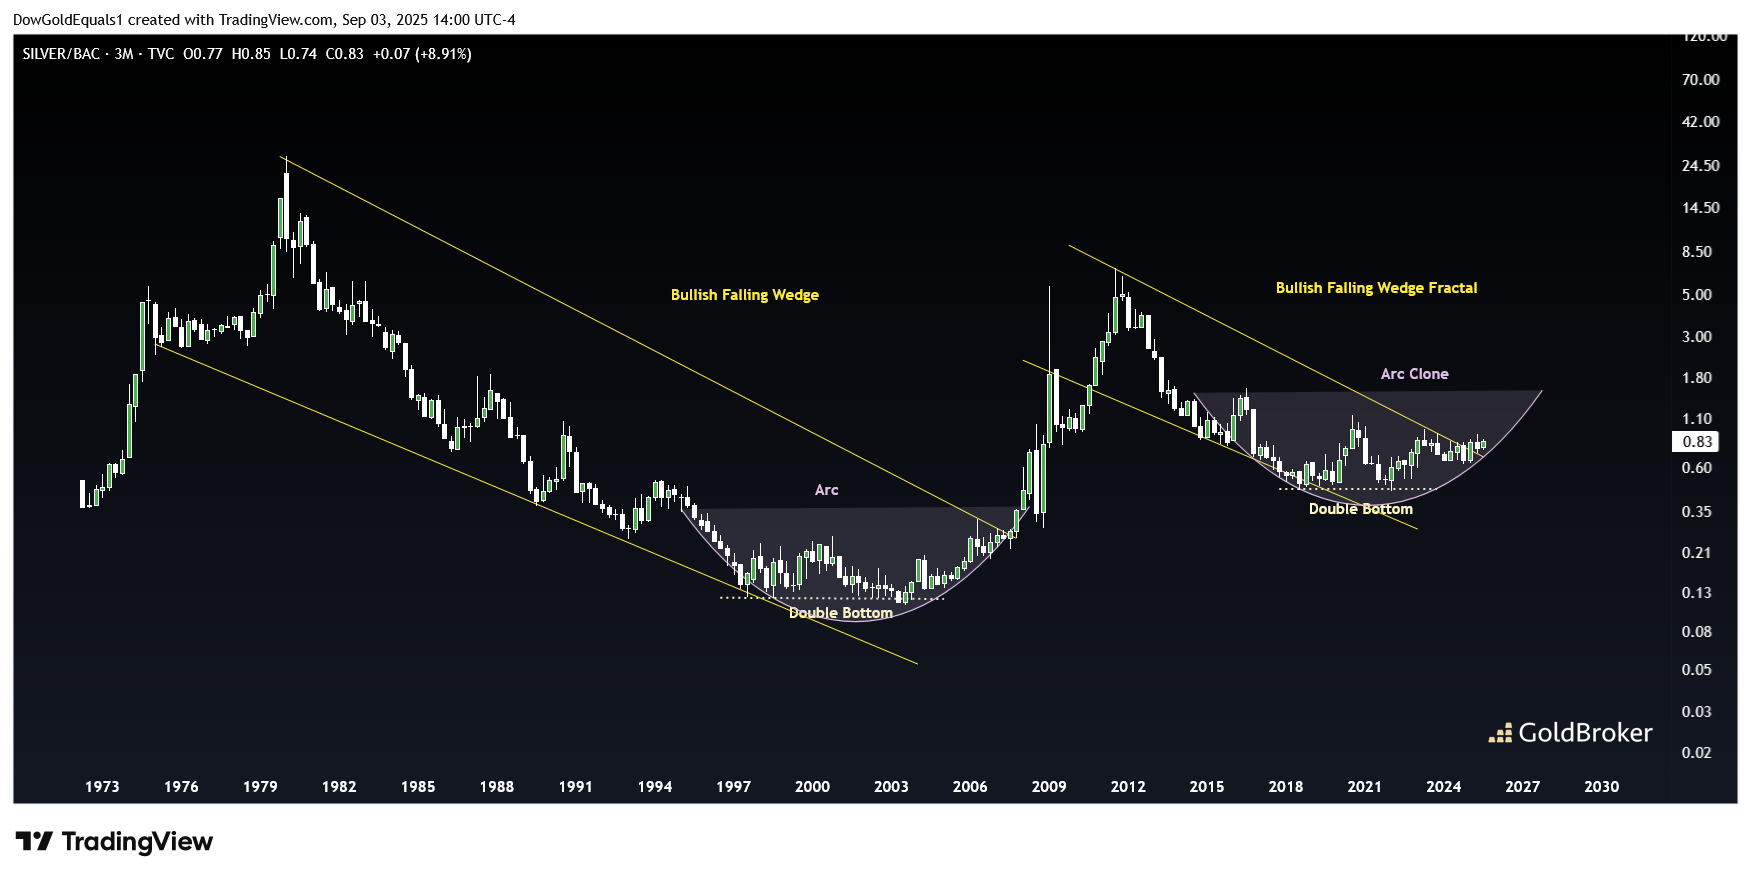
The second chart is a fascinating look at Silver/BAC.
Note the first 30-year bullish falling wedge that launched an epic silver bull in the early 2000s and the fractal wedge that has just broken out. Each wedge featured a double bottom and very similar rounded bottoming structures (though the current arc is still taking shape).
All that is left seems to be an impulsive move higher like the one we saw in the early 2000s and into the Global Financial Crisis.
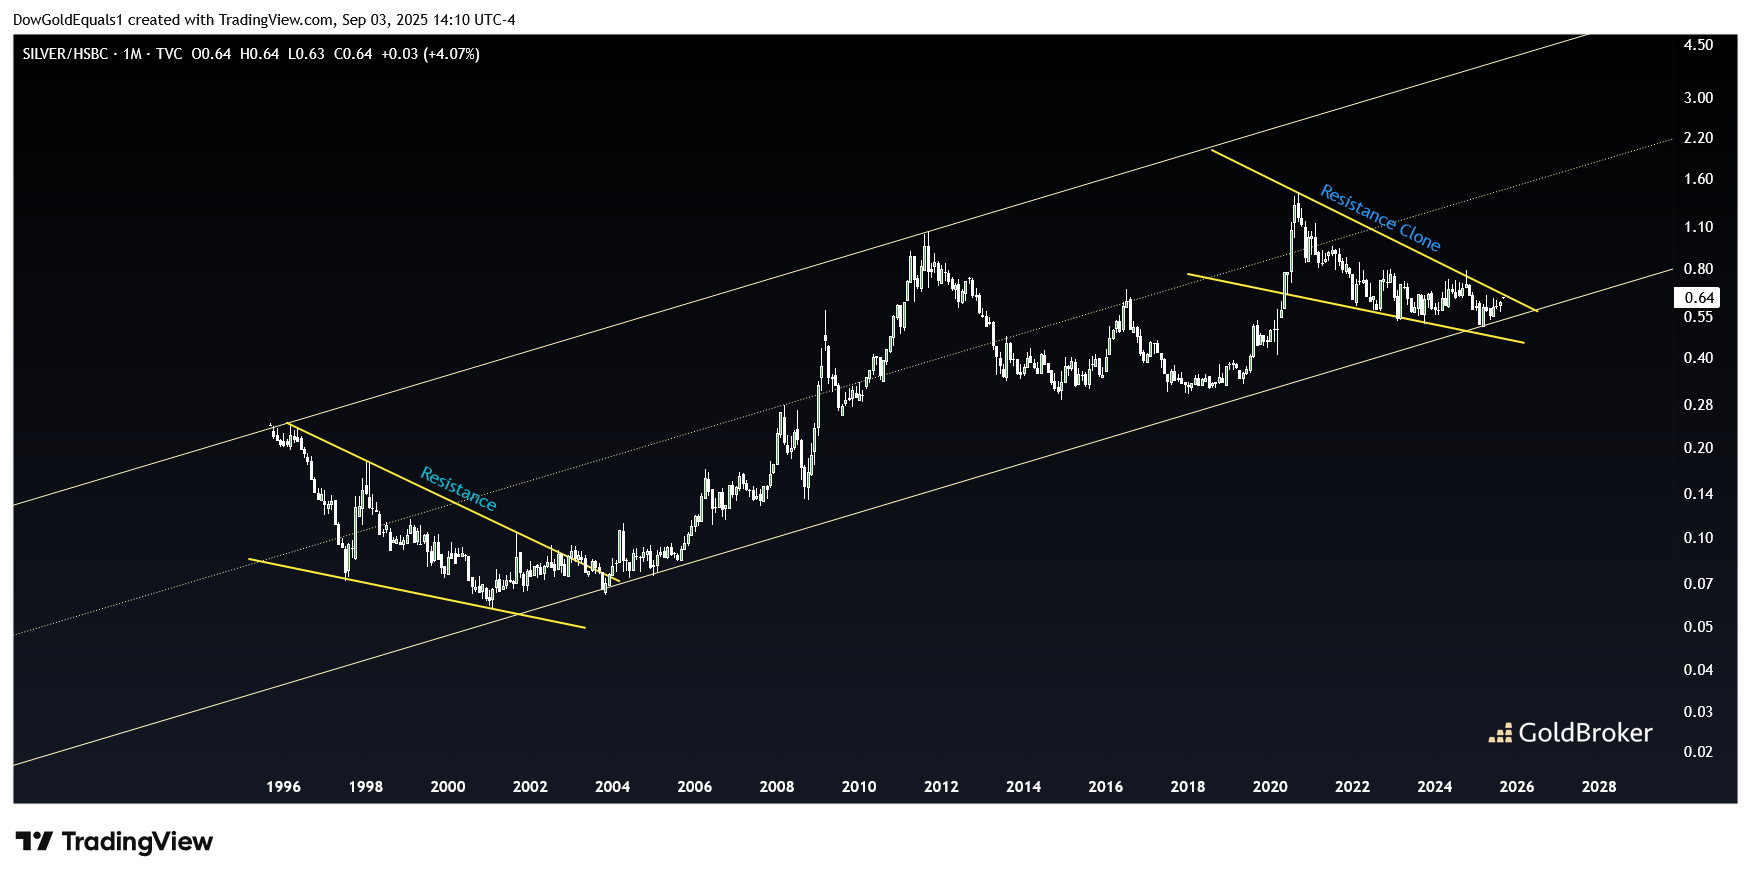
The last chart is of Silver/HSBC, which features a pretty clean ascending channel. Note the fractal wedges, but more so that the ratio is sitting near the lower rail. Whenever this ratio has been at the lower rail, it has been a terrific time to buy silver and sell HSBC.
So if you're wondering if silver has more room to run, I would say that we haven't even gotten started yet. And if you happen to be holding stocks of big banks, now could be your chance to make a pretty smart exchange.
More By This Author:
Trump And The United States At A Turning PointUnited States: Heading Towards A Real Estate Crisis Worse Than The Subprime Crisis?
Gold & Silver In World Currency Units Suggests A Next Leg Higher


Comments
Log in or sign up to join the conversation.