
Intermediate Market Top Reached?

Cycles: Looking ahead
7-yr cycle – Last lows: 2009-2016. Next low: ~2023
Market Analysis (Charts, courtesy of StockCharts)
SPX Weekly chart
It has been a long steep climb for SPX since the March 2020 low. Is it coming to an end? It is probably more appropriate than to say: “it’s over”, but it may not be too much longer before we can use the latter terminology. There are signs of rolling over in the trend itself, and these are especially noticeable in the various indicators. The combination of an overbought RSI with negative divergence in the CCI, and an even more urgent warning from an SRSI that has already reversed from a lower level are all calling for caution. But this should not be a surprise. The IWM (on the right) has been screaming “watch out” for a long time -- for so long, in fact, that many have stopped listening.
So, what are we looking at? Best guesstimate is that we have arrived at an intermediate top which will precede the bull market top by a few weeks; this, at least, is what the long-term projection derived from the 2020 P&F low tells us. We are still a little short of the ultimate 4550 target which is predicted. Until we have a major sell signal, that will remain the final destination, which can’t be too far away with the next 7-year cycle well past its peak.

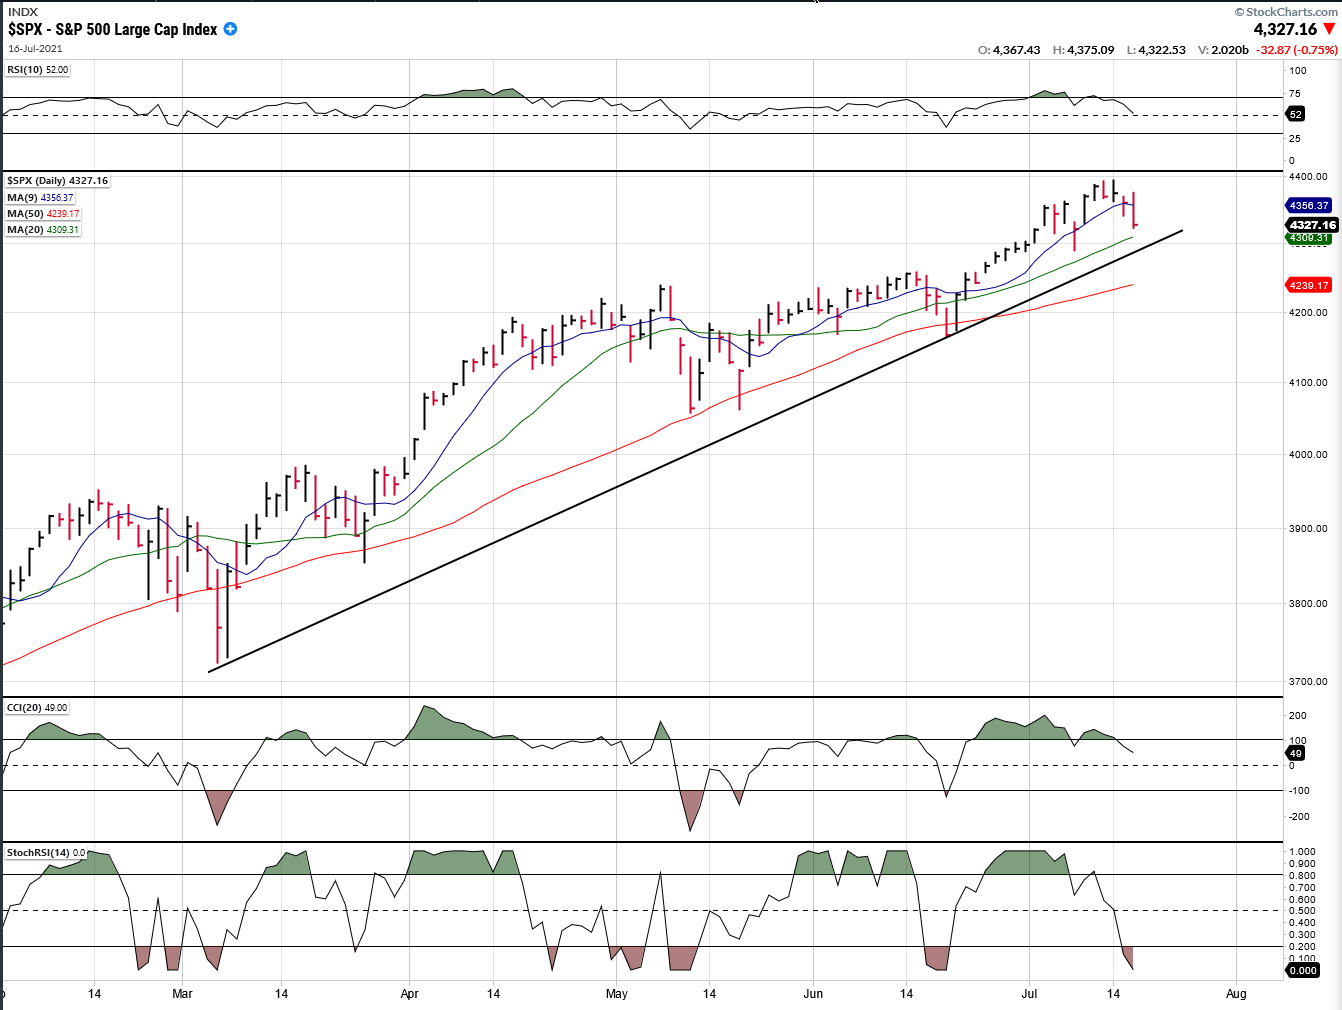
SPX daily chart
On the daily chart, this is the trend line that we are expecting to break right now, and it spans the market phase which is ending and that we are expecting to correct. There is still a little ambivalence as to whether the final high has been reached with the 4393-figure printed last week, or if we can still go a few points higher to ~4440 to satisfy the count derived from the base which started this uptrend. The short-term cycle which is responsible for last week’s weakness may have bottomed on Friday and we’ll see what kind of a short-term rally it can muster during its next up phase. Whatever it is, it will soon be neutralized by the larger cycles which are in the process of topping.
The McClellan oscillator, which is shown below, and which tends to warn of market weakness ahead of the index itself, has already issued a sell signal, so how much more of a price lift can be exerted from here is questionable. Whether a new high is reached or not, it is clear that the uptrend from March 2021 is living on borrowed time.

SPX hourly chart
The hourly chart shows the effect of the short-term cycle on prices. Assuming that it is at or very close to the end of its phase, it suggests by the fact that it peaked so late in it, that the SPX top formation is not likely to be complete and that the next short-term uptrend could even exceed last week’s high of 4393. This is supported by the P&F formation which generated this uptrend from the March level. Although the 2020 bottom pattern suggested that this intermediate trend could reach the mid-4300s, the 3723 formation produced a count to 4440. I had originally focused on the former for my forecast, but because the latter is more recent, it could give us a more accurate projection. And besides, if we are going to correct the move which started at 3723, a normal retracement of 50% should take us down to about 4030; and not enough congestion has yet occurred to reach this projection level.
Supporting a proximate cycle low is an oversold RSI and a CCI which exhibits positive divergence. Friday was the ideal time frame for a low and the short term top count has essentially been met.

GDX (gold miners) (dly)
GDX could not get much of a lift out of its short-term cycles, but the index has found support on its correction trend line and, so far, it has not broken below its recent low. This suggests that it is building a base from which -- as long as it holds support -- it will eventually break-out. If it does so in the near future, it will only be capable of a move to ~37-37.50. However, if we extend the formation to November of last year, we can see that a reverse head & shoulder pattern may be forming, and if this turns out to be valid, then a 20-point uptrend could be generated. Time will tell.

PAAS (dly)
PAAS does not sport a H&S bottom, but it is trading at the bottom of a consolidation pattern that started after it reached its high point in August of last year. If that entire formation turns out to be a base, then it would also be capable of a move of 20-25 points, but for the time being, it just made a new short-term low which suggests that it is not ready to go anywhere unless the damage is quickly repaired.

BNO (Brent oil fund) wkly
BNO has violated its secondary uptrend line, but it has not yet traded below the 9-wk MA. It would have to do that in order to suggest that it has started a correction of several weeks. There cannot be any serious correction until it breaks its primary bullish trend line. However, structurally, it has completed 5 waves and most likely filled a base projection on the P&F chart. So, a corrective move is probably in order.

USD (dollar) (wkly)
The dollar may be range-bound between 90 and 93. It’s even becoming questionable if it can reach the top of that range over the near term since it has traded below 92.85 over the past two weeks without being able to surpass that level. However, the SRSI is oversold and could produce one more upside thrust before price falls below 92.00.

SUMMARY
SPX is still making new highs and, with the short-term cycle having most likely made its low after only producing a minor pullback, it is likely that one more high, perhaps to 4440, is in the works over the next couple of weeks.
Current Position of the Market
SPX Long-term trend: There is some evidence that we are still in the bull market which started in 2009 and which could continue into 2021 before major cycles take over, and it ends. A move up to ~4500 is possible before the current bull market makes a final top and SPX corrects into its next major cycle low due in 2023.
SPX Intermediate trend: SPX has likely reached the end of an intermediate phase.
The above comments, as well as those made in the daily updates and the Market Summary about the financial markets, are based purely on what I consider to be sound technical analysis principles. ...
more

