
How To Know When The Precious Metals Pullback Is Over

Image Source: Pixabay
The precious metals selloff may be close to running its course, according to a highly reliable methodology.
As you’ve likely heard, the inevitable pullback in precious metals continued yesterday, with spot gold dropping 5.29% and spot silver falling 7.03%, marking the sharpest one-day decline in over a decade.
That said, I’m not worried.
This is simply a continuation of the temporary pullback and consolidation. I urge everyone to keep things in perspective, avoid panic, and stay focused on the very bright long-term outlook for precious metals.
I’ll show you how to assess when this sell-off is likely to come to an end.
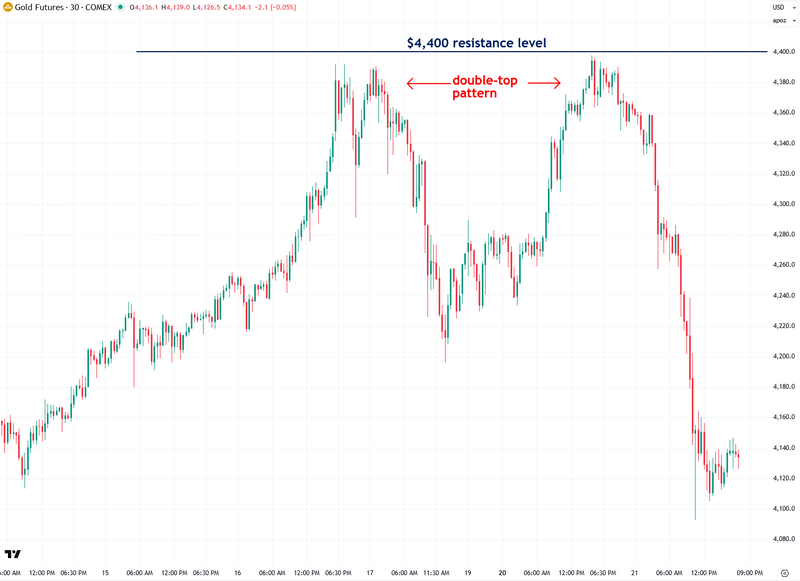
First, I want to highlight something notable on gold’s intraday chart over the past week. It formed a double top pattern exactly at the $4,400 level, which was the exact same price target I identified back on August 4th, before the $1,000 surge.
Sure enough, gold hit that level on the nose, tested it a second time for confirmation, and then began to sell off starting Tuesday morning. The key point here is that the recent rally phase of the ongoing precious metals bull market had a pre-defined magnitude, which is why this pullback isn’t random or unexpected.
Next, I want to explore how to assess when the current pullback in precious metals and mining stocks has likely ended, and when they should stabilize and start recovering.
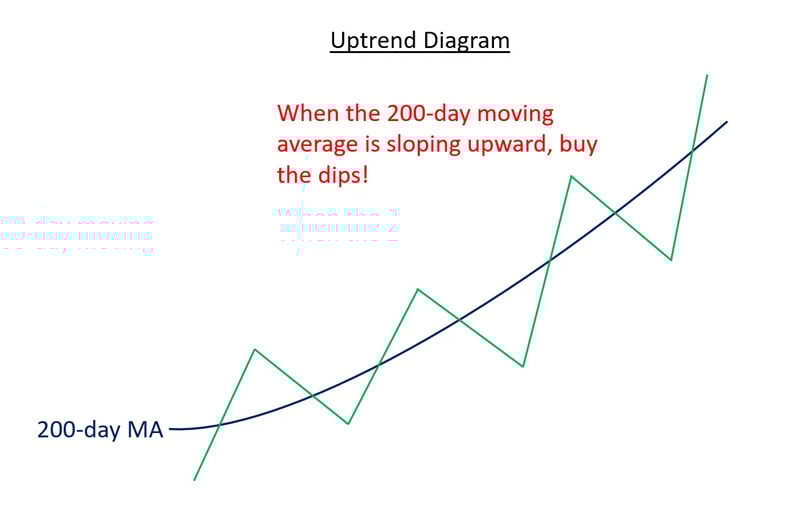
The core idea of that methodology is to trade with the trend, not against it. One of the most reliable ways to identify the trend is by observing the slope of the 200-day moving average (MA).
If the 200-day MA is sloping upward, which is still the case across the precious metals space, the best approach is to embrace the uptrend and consider using pullbacks or oversold periods to add to your position.
Oversold conditions within confirmed uptrends are typically short-lived, and the current pullback in precious metals fits that pattern well.
That’s exactly what I’m going to show next.
The diagram below illustrates a confirmed uptrend based on the 200-day moving average, showing how oversold readings or dips are typically short-lived and typically followed by further gains:
Now, armed with that knowledge, let’s take a look at where the precious metals arena stands, starting with gold.
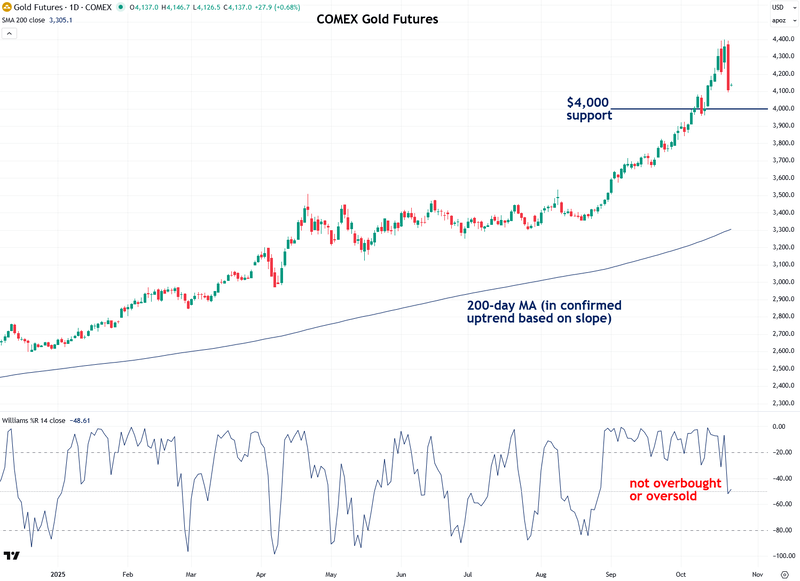
As you can see, its 200-day moving average is sloping clearly upward, which indicates that gold is in a confirmed uptrend. In this context, the wisest approach is to align with the trend and tune out negativity.
To assess when the pullback has likely run its course, I turn to one of my favorite tools: the Williams %R indicator. This is a momentum indicator that helps identify overbought and oversold conditions.
Currently, as shown at the bottom of the chart, gold is no longer overbought as it had been since late August, which is a good sign.
What I’m looking for next is an oversold reading from %R. That would give me more confidence that the selloff has run its course and that gold is ready to continue in the direction of the primary trend once again, which is up.
Also worth noting is the $4,000 level, which is likely the new floor for gold. Some further downside is possible as gold tests that support level, which would consequently trigger an oversold reading on %R. Assuming that occurs, I’ll feel much more confident saying the worst is over and that it’s time to shift focus back to the upside.
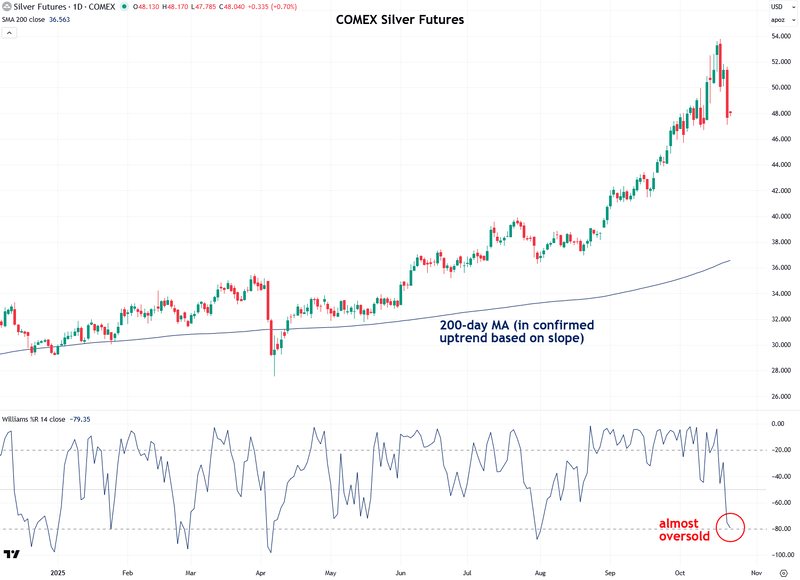
Like gold, silver is also in a confirmed uptrend based on the 200-day moving average. However, it has already nearly reached oversold levels on Williams %R, indicating that the selloff has largely run its course.
Think of it as a quick flush: rip the Band-Aid off, clear out the overbought condition, and set silver up to continue its strong bull market, which is still in its early stages.
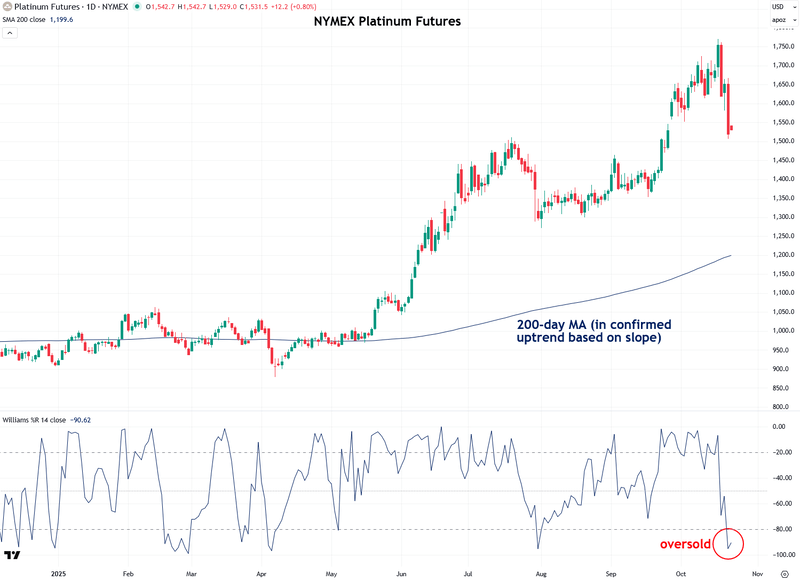
A look at platinum shows that it has already reached oversold levels while remaining in a confirmed uptrend, which is a reassuring sign for the bulls.
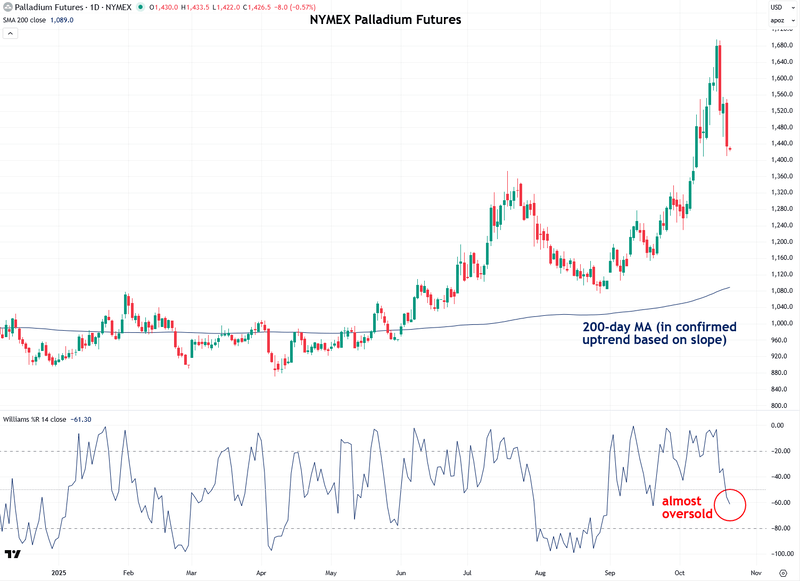
Palladium is also in a confirmed uptrend, but like gold, it hasn’t yet reached oversold levels according to Williams %R. However, it is likely to do so soon, which should set it up to recover and continue its bull market.
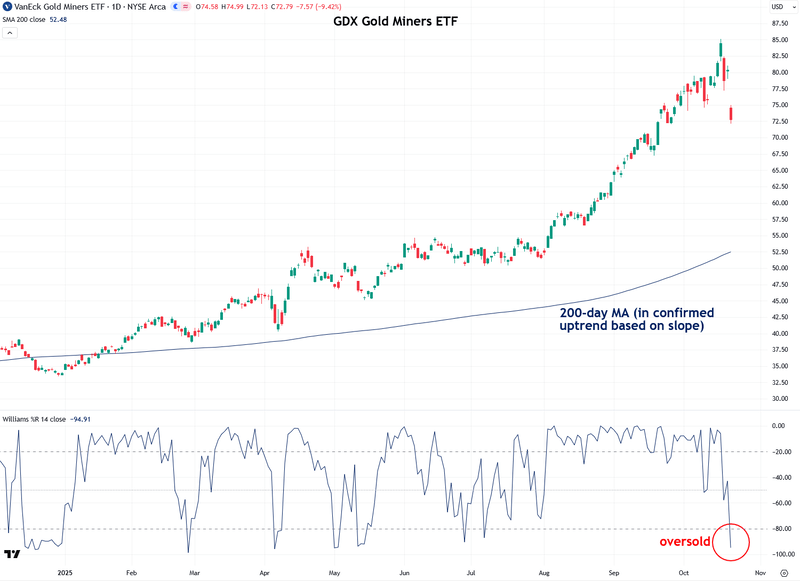
Next, let’s move on to mining stock ETFs, starting with the popular GDX gold mining stock ETF. After its sharp decline over the past week, GDX is now in deeply oversold territory but remains within an uptrend according to the 200-day moving average.
This indicates that the worst of the gold mining stock selloff is likely behind us and that GDX should soon stabilize and resume its strong bull market, which, in my assessment, still has at least another decade to run.
Now I want to address another point, which is to dispel a claim that many naysayers have been repeating during the recent selloff. They argue that gold has just reached a multi-year, or even decade-long, peak and that the bull market is officially over, with only downside ahead.
I strongly disagree with that view for many reasons. I continue to expect gold to reach at least $15,000 an ounce over the next five to ten years. In fact, I believe it will eventually go much higher than that, but I don’t want to freak everyone out more than I already do.
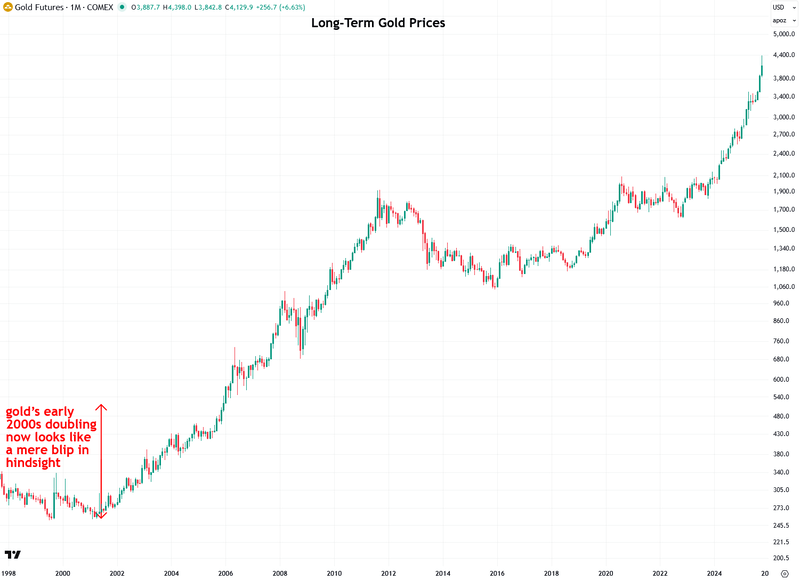
One of the many reasons I don’t believe gold’s bull market has ended this early is the massive long-term cup and handle pattern that formed over the past thirteen years.
The sheer magnitude of this pattern indicates that much larger gains lie ahead, similar to the 2000s bull market I highlighted on the chart.
Gold only broke out of this cup and handle formation in March 2024, which means the current bull market is just 1.6 years old. That is still very young compared to past secular gold bull markets, such as the one in the 1970s that lasted nine years, and the one in the 2000s that lasted a little over a decade.
I fully expect the current bull market to last at least a decade, which means it is only getting started, with much more upside still to come.
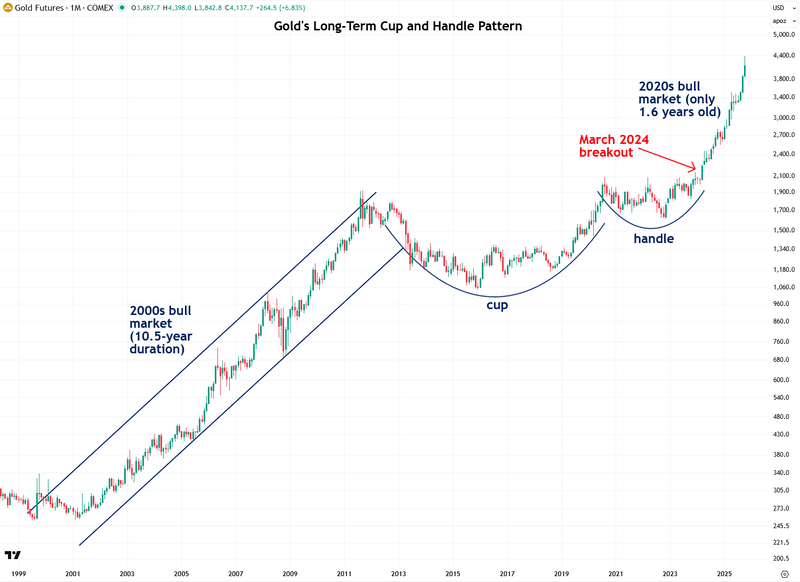
I also want to point out that gold has roughly doubled, or risen about 100%, during the current bull market over the past 1.6 years. However, that is still a relatively modest gain compared to the 2000s bull market, during which gold surged by 630%.
I have also plotted what it looked like when gold doubled during that earlier bull market, and in hindsight, it appears as just a small blip because of the much larger gains that followed.
I believe the same will be true of gold’s recent doubling. When gold reaches $15,000, $20,000, and eventually well beyond that, this early move will look just as minor.
While the current bull market may seem impressive in terms of dollar amounts, it still has a long way to go percentage-wise to match the scale of previous secular bull markets. But I believe it will not disappoint.
Anyway, to wrap things up, I understand that yesterday's selloff in precious metals and mining stocks was nerve-wracking and unpleasant. I wasn’t in the best of moods myself.
What helps me is keeping the much bigger picture in mind, which remains strongly bullish for both gold, silver, and mining stocks.
Even in the shorter term, the bull market in precious metals is still firmly intact, as shown by the upward-sloping 200-day moving averages across all the major precious metals and mining stock ETFs.
The pullback over the past few days has cleared out the frothy, overbought conditions, and we are now venturing into oversold territory. That indicates that we are getting closer to the end of this pullback, and there is strong reason to believe that brighter days lie ahead, possibly even before the year is over.
More By This Author:
Silver Clears $50, Breakout Confirmed
Gold & Silver Smash Through Key Levels
Palladium's Big Bull Market Has Begun
For the author's full disclosure policy, click here.


