How Euro’s Troubles Can Exacerbate Gold’s Woes
The EUR/USD currency pair faces significant headwinds. How does this affect the precious metals? What does it spell for gold?
Many people, analysts included, often overlook the multitude of external factors influencing the precious metals. It’s something that I point to and stress in many analyses. These factors can include the shape of the European economy, for example. One has to look at the big picture.
Here’s how it works. Because the EUR/USD accounts for nearly 58% of the movement in the USD Index, anytime that Europe’s economy underperforms that of the U.S. (which is what it’s currently doing), it’s a negative for the euro and bonus points for the dollar. Because the precious metals have a strong negative correlation with the USD Index, a rise in the dollar in the very near future will further serve as downward pressure on the metals.
Additionally, higher inflation and resultant higher interest rates in the U.S. are another negative factor for the euro and a positive one for the USD.
However, before we travel to Europe, let’s take a look at how the precious metals are currently doing, starting with gold.
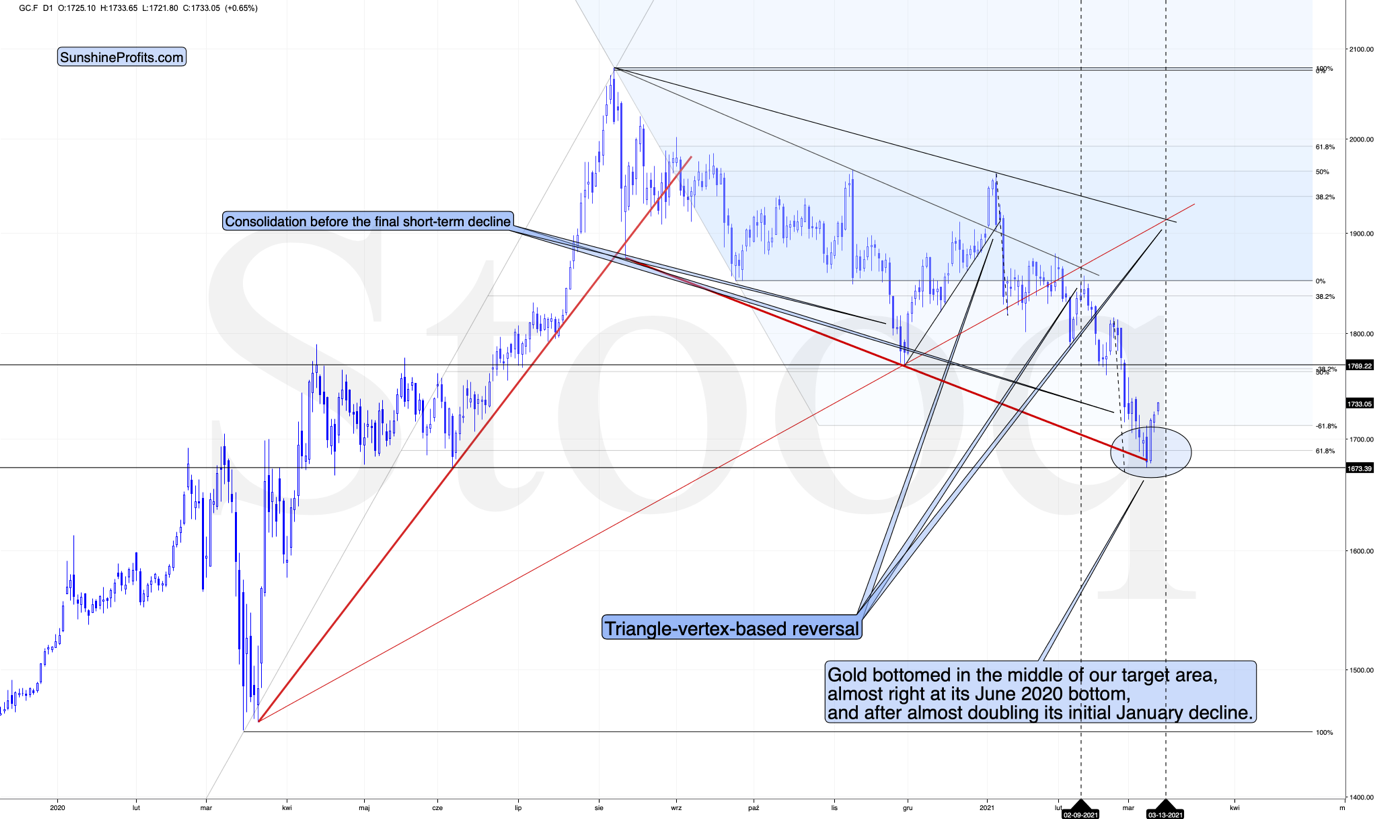
Gold rallied strongly after bottoming right in the middle of my target area and after moving almost right to its June 2020 bottom, and after almost doubling its initial January decline. Yesterday’s rally also meant invalidation of the brief breakdown below the 61.8% Fibonacci retracement level based on the entire 2020 rally. Thus, the very short-term trend is up.
Please keep in mind that the upswing might be relatively short-lived – perhaps lasting only one week or so. There’s a triangle-vertex-based reversal point coming up this Monday (Mar. 15), so it wouldn’t be surprising to see an interim top at that time, especially considering that:
- The triangle-vertex-based turning points have been working particularly well in the recent past – they marked the January and February tops.
- The corrective upswings during this medium-term decline (especially in mining stocks) often took about a week to complete – at least the easy part of the upswing took a week.
The thing that I want to add here – that already takes us to the part where I discuss the gold-USD link – is that gold rallied overnight. It’s currently up by about $10. This doesn’t mean much by itself, but it does mean a lot, when we compare it with the analogous action in the USD Index.
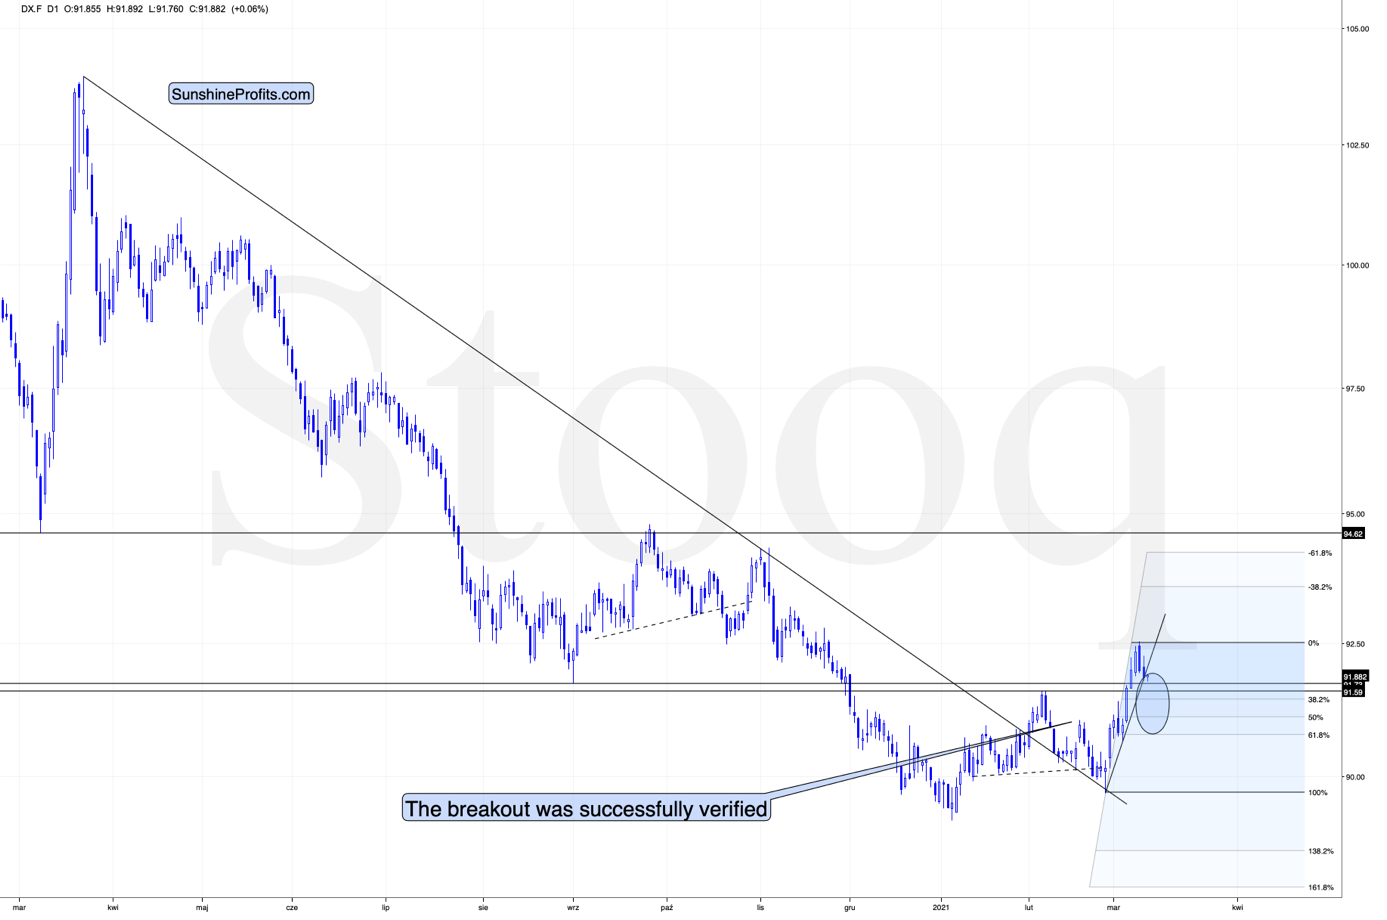
Namely, the USD Index is up by 0.06%. It’s not important that it’s 0.06%, but it’s important that it’s a tiny upswing and not a decline.
In other words, gold just continued to move higher, even though the USD Index paused after a brief decline. This tells us that the shape of both price moves doesn’t have to be identical. Well, to be clear, it was known right from the start, but it’s often the case that the daily price moves in gold and USDX mirror each other.
So, can the bottom in the USD Index form at about 91.6 while gold rallies to ~$1,770. Of course.
One of the ways in which this could be done is for the USD Index to rally a bit here while gold ignores that and rallies anyway – which is what we already see taking place right now – and then when the USD Index declines to 91.6 or so, gold would rally even more. Gold is only $40 away from the above-mentioned upside target, so it won’t take much to get it there. For instance, we might see another $10 rally while the USD Index pauses, and then a $30 rally when the USDX finally declines, and bottoms.
Moreover, please note that the USD Index could move below 91.6 on an intraday basis and then rally back to it in terms of the daily closing prices. The previous 2021 high in terms of the closing prices was 91.52. So, actually, the USDX could decline to one of the Fibonacci retracements on an intraday basis before getting back up. The classic retracements based on the recent move higher are:
- 38.2% - 91.44
- 50% - 91.10
- 61.8% - 90.77
Also, based on the entire 2021 rally, the retracements would be:
- 38.2% - 91.25
- 50% - 90.85
- 61.8% - 90.45
Consequently, the USD Index could decline to one of those levels (more likely to 91.10 – 91.44 than to 90.45 – 90.85) and then rally back up on an intraday basis, and the analogy to how the situation developed in 2018 would still remain intact.
Combining both above details (gold’s temporary outperformance and the possibility for the USD Index to decline below 91.6 on a very temporary basis) suggests that the rally to $1,770 in gold, and the brief decline in the USD Index can indeed take place together.
Let’s take a look at the silver market.
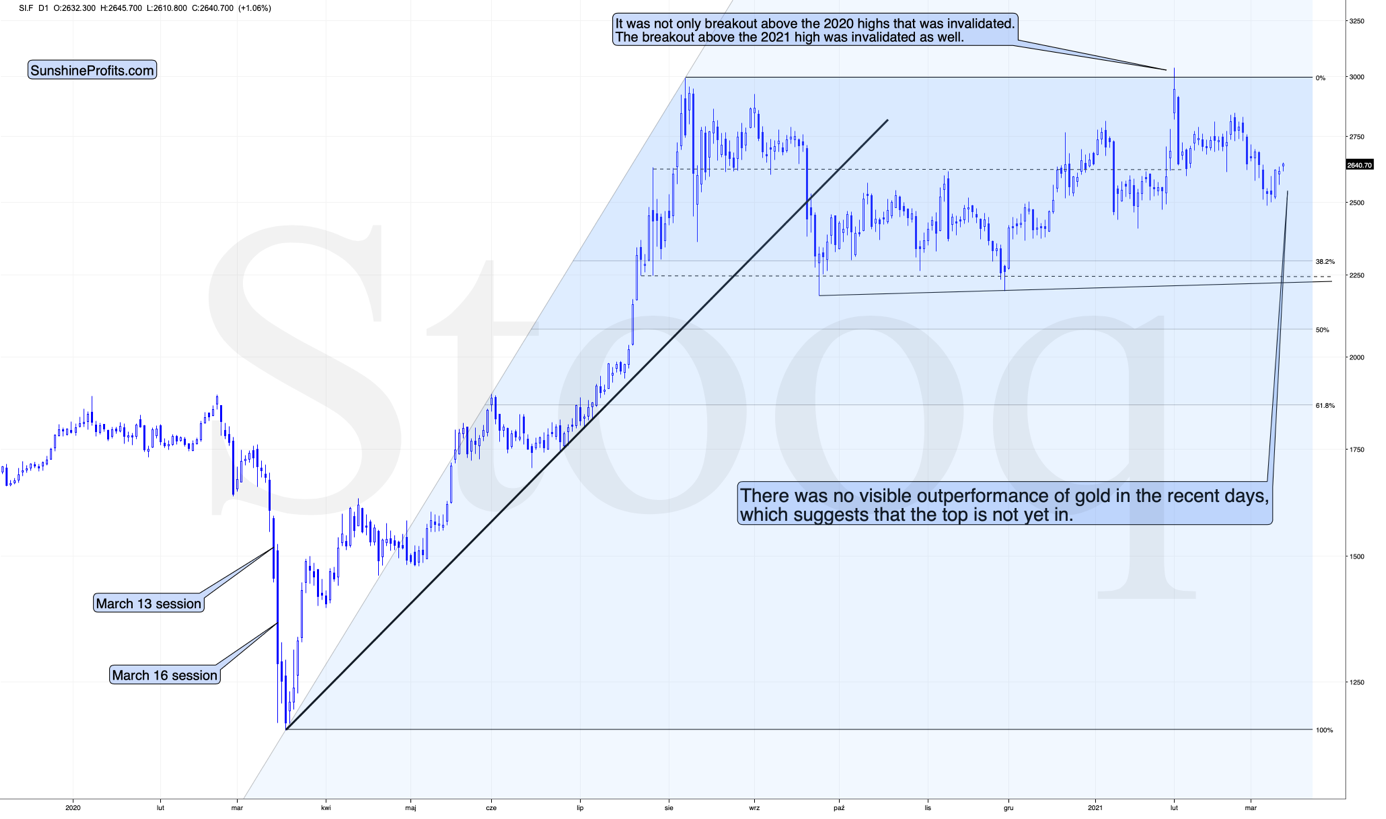
The thing that I want to emphasize here, is that silver’s recent performance was… Average. This is informative because silver tends to outperform gold in a visible way close to the top. Average performance means no outperformance, which in turn means that the top is likely not yet in.
Having said that, let’s take a look at the market from the more fundamental angle.
Fundamental Frailty
With the USD Index taking a breather, the PMs should continue their short-term shine.
However, with the USD Index poised to soar over the medium-term, the EUR/USD will play a significant role. For context, the EUR/USD accounts for nearly 58% of the movement in the USD Index. As a result, Europe’s fundamental underperformance should help ignite the USD Index’s fire.
On Mar. 9, The Organisation for Economic Co-operation and Development (OECD) released its Interim Economic Outlook. And revealing what I’ve been writing about for over a month, the latest projections are dollar-positive and euro-negative.
Please see below:
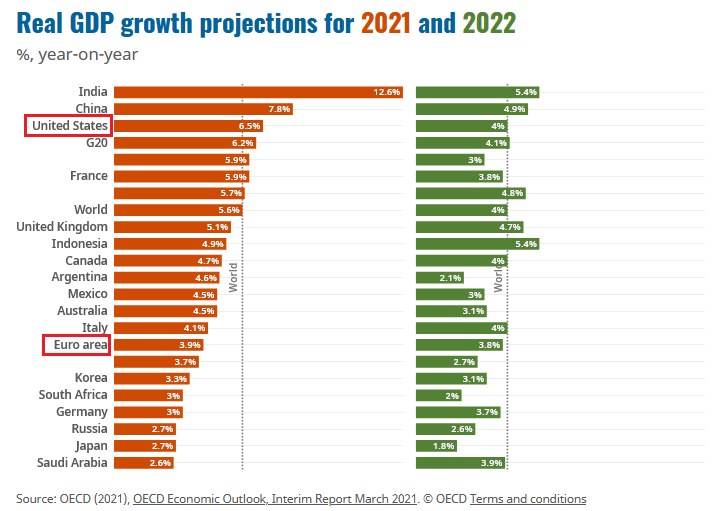
If you analyze the chart above, you can see that the U.S. economy is projected to grow by 6.5% in 2021 and 4.0% in 2022. Conversely, the Eurozone economy is projected to grow by 3.9% in 2021 and 3.8% in 2022.
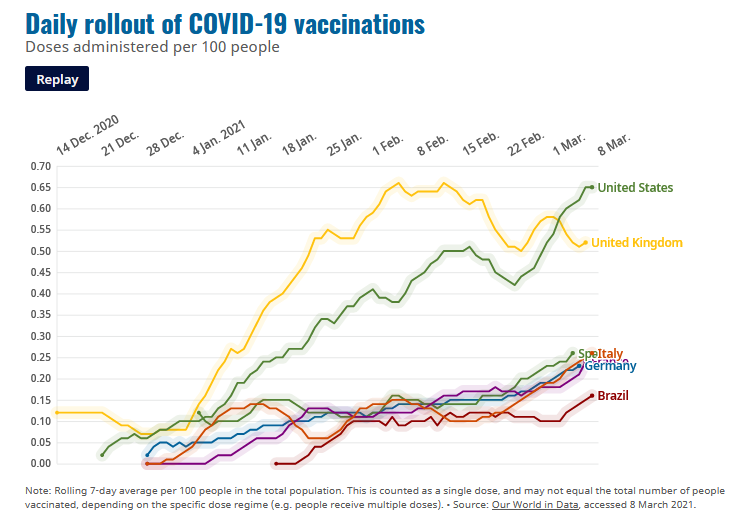
At the core of the expected divergence, daily COVID-19 vaccinations in Germany, France, Italy, and Spain – Europe’s four-largest economies – lag the U.S. by a staggering margin.
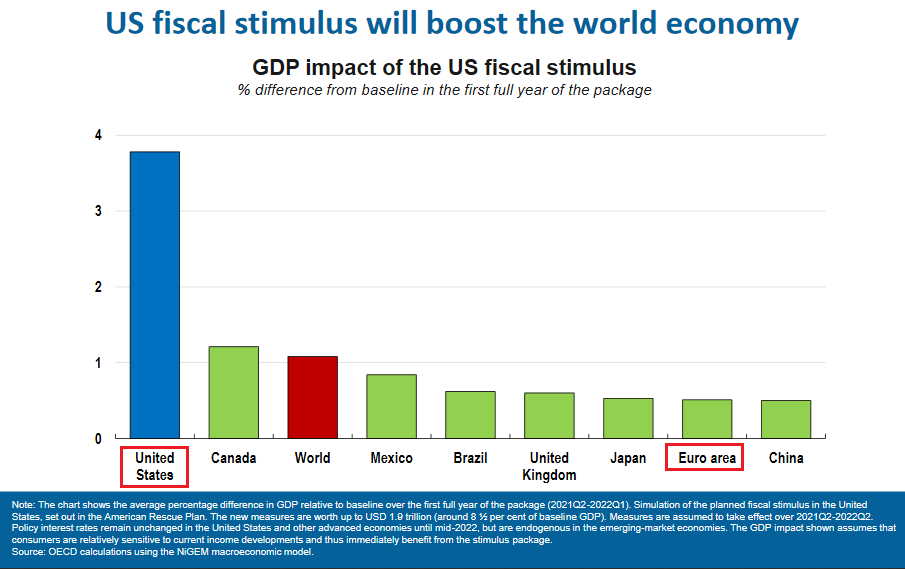
What’s more, Joe Biden’s $1.90 trillion stimulus package is expected to have a profound impact on the U.S. economy. And the Eurozone? Well, not so much.
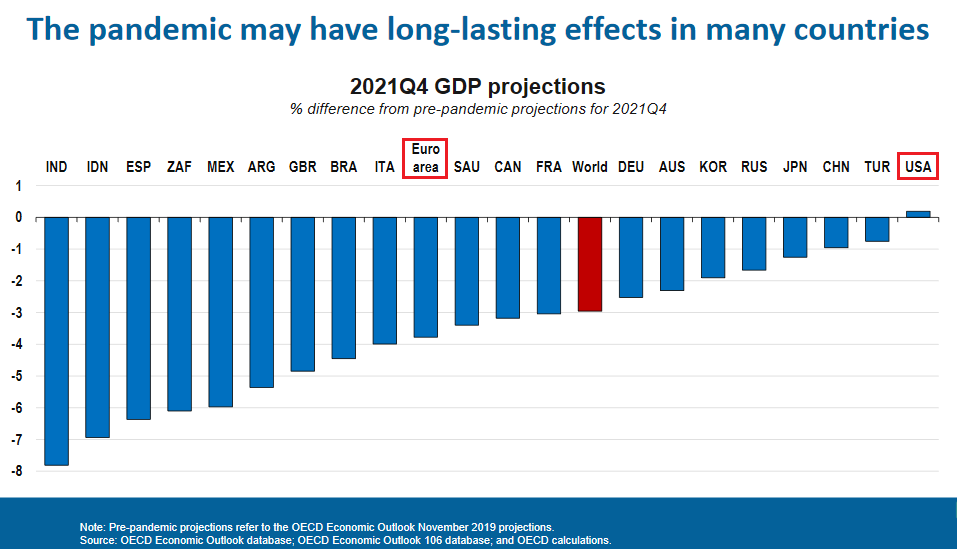
Furthermore, pandemic-induced scarring is expected to burden the Eurozone economy for some time. If you analyze the chart below, you can see that OECD analysts have reduced their Eurozone Q4:2021 GDP forecast by 4.0%. In stark contrast, the group has actually increased its U.S. Q4:2021 GDP forecast.
But because seeing is believing, notice how Eurozone economic activity does and is expected to, lag the U.S. by a wide margin?
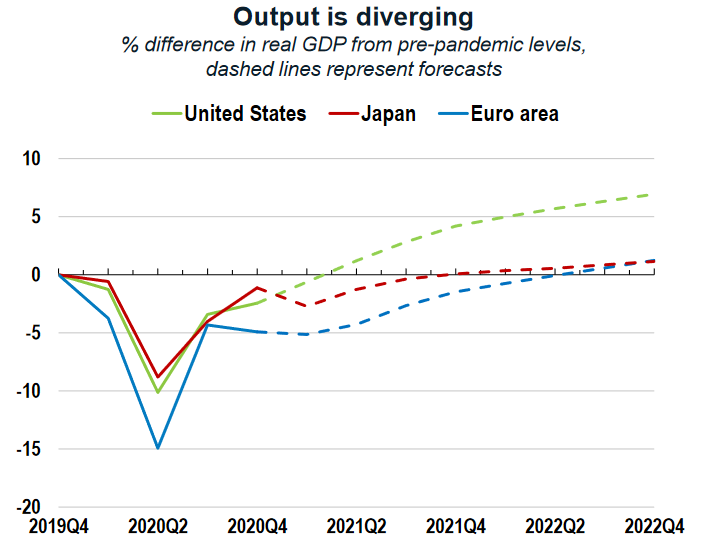
Source: OECD
To explain, the solid (and dotted) green line above depicts the performance of U.S. real GDP, while the sold (and dotted) blue line above depicts the performance of Eurozone real GDP. Representing historical data, if you focus on the two solid lines, you can see that the U.S. recovery is tracking well-ahead of the Eurozone. And because the dotted sections track OECD analysts’ projections, you can also see that the U.S. is expected to recoup its pre-pandemic GDP growth by roughly the second-quarter of 2021. Conversely, the Eurozone isn’t expected to recoup its pre-pandemic GDP growth until the second quarter of 2022.
To that point, data compiled by Bloomberg is just as pessimistic.
Please see below:
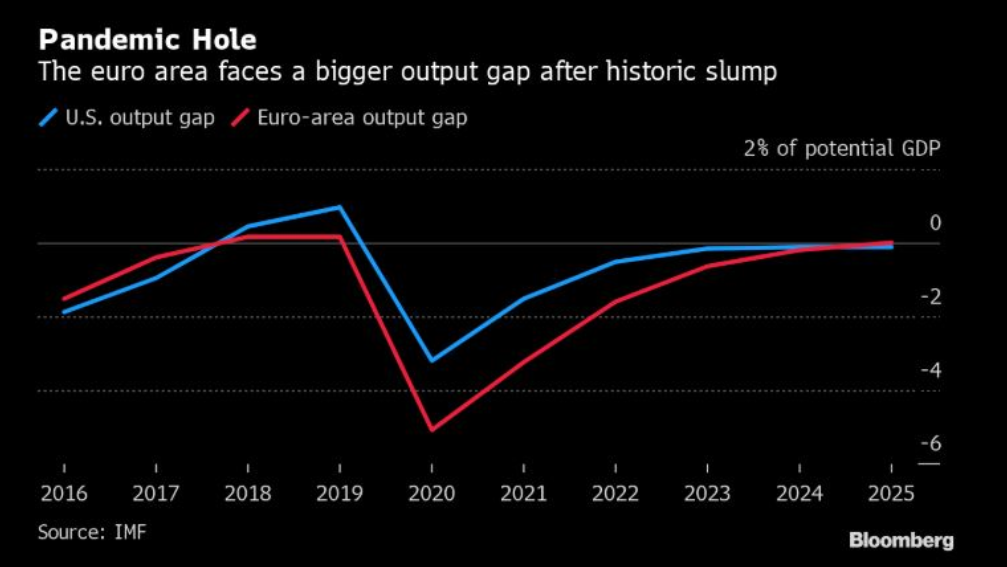
To explain, an output gap is the difference between a region’s actual and its potential GDP. With the blue line above representing the U.S. and the red line above representing the Eurozone, you can see that the U.S. is expected to close its output gap by 2023. But lagging behind, the Eurozone isn’t expected to close its output gap until 2024.
On a more granular level, The European Commission’s Winter 2021 Economic Forecast (released on Feb. 11) predicted that Eurozone GDP growth (3.8%) would be headlined by France’s outperformance in 2021.
On Feb. 17, I wrote:
The report forecasts that France (the yellow box below) – Europe’s second-largest economy – will deliver 5.5% GDP growth in 2021.
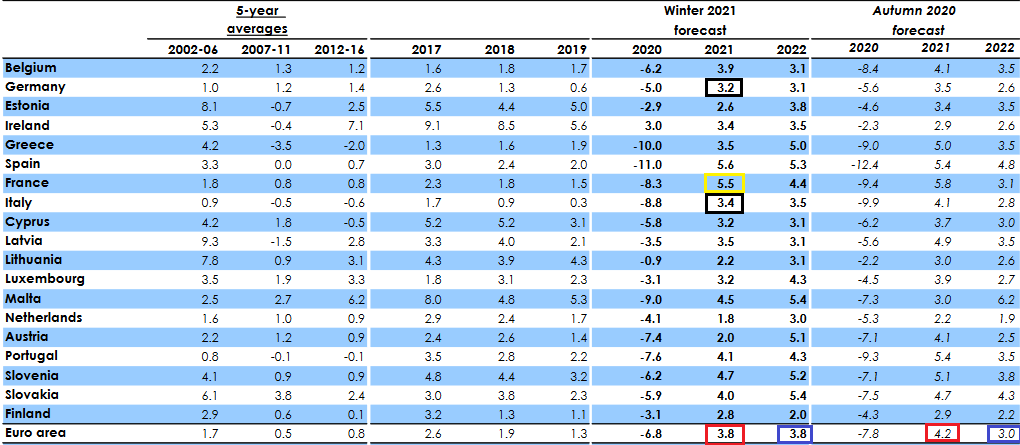
Source: European Commission Winter 2021 Economic Forecast
With ambitious being an understatement, it was less than two weeks ago (Feb. 4) that IHS Markit’s Eurozone Productivity PMI fell for a third-straight month (to 47.4 in January) and declined at its fastest pace since June. More importantly though, the report cited France and Italy’s service sectors as the main weak spots (the yellow boxes below).
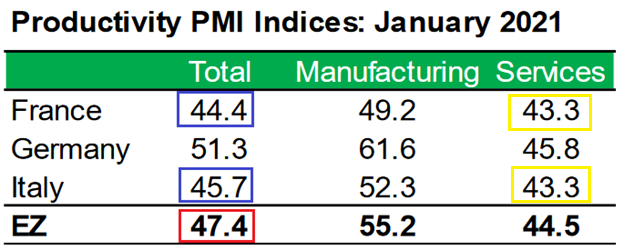 Source: IHS Markit
Also contradicting the projection, IHS Markit’s Eurozone Construction PMI report (released on the same day) read that “France posted the steepest rate of contraction.” With that in mind, does it seem likely that France will outperform 18 of 19 European countries in 2021?
And with the latest data not instilling any more confidence, February’s IHSMarkit’s Eurozone Composite PMI (released on Mar. 3), revealed that “overall declines were recorded … with Ireland again recording the sharpest contraction, followed by Spain and then France.”
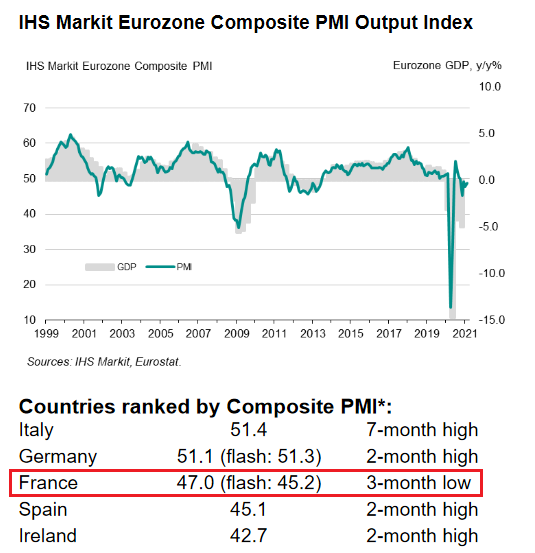
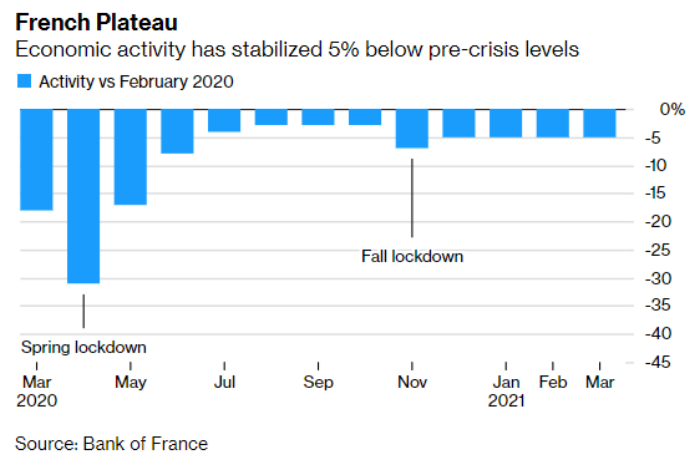
If that wasn’t enough, data from the Bank of France confirms that the French economy has plateaued – at 5% below pre-pandemic levels – since November.
Please see below:
Also raising alarm bells, I warned on Feb. 19 that the European banking sector remains on high alert.
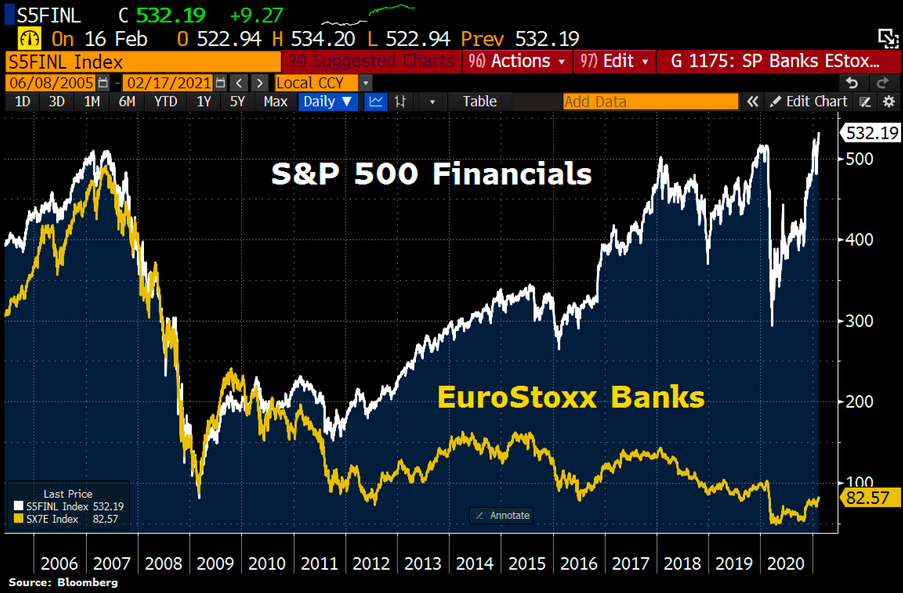
If you analyze the chart above, you can see that S&P 500 banks (the white line) have traded sharply higher since September. In stark contrast, European banks (the yellow line) have struggled to keep pace.
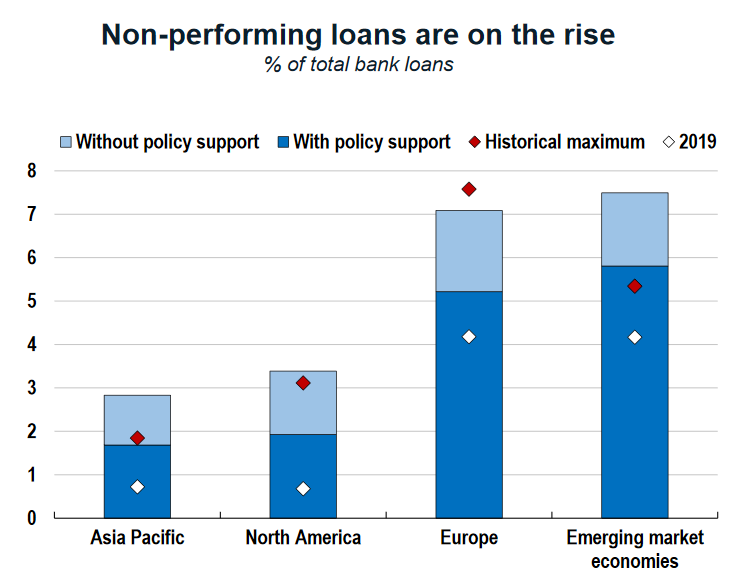
And able to see the forest through the trees, European officials warned on Feb. 15 that the Eurozonecould be on the verge of“wide-scale corporate distress.” In a document presented to European finance ministers, officials highlighted that 25% of European businesses were in financial trouble prior to the New Year. And with the “underlying deterioration” masked by government assistance, banks’ loan loss provisions may have underestimated the potential impact.
And hitting the nail on the head, the OECD’s report shows that more than 7% of bank loans across Europe are considered nonperforming. For context, a nonperforming loan (NPL) means that a borrower has failed to make interest and/or principal payments over a period of 90 or 180 days (usually). The International Monetary Fund (IMF) also considers a loan nonperforming when it’s been delinquent for less than 90 days, but there is significant uncertainty regarding future payments.
Please see below:
Source: OECD
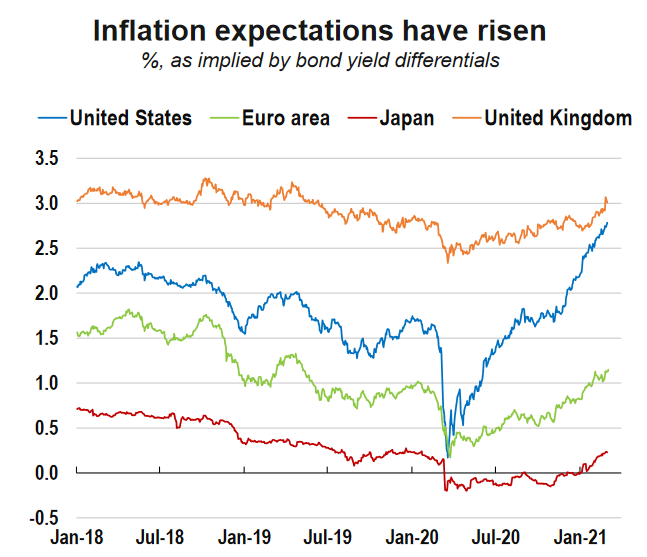
As another negative for the euro, European inflation expectations continue to lag the U.S. Creating a domino effect, I’ve noted on several occasions that higher inflation is a precursor to higher interest rates. And because higher interest rates are a precursor to a stronger currency, U.S. inflation outperformance is bearish for the EUR/USD.
Source: OECD
To explain, the green line above tracks inflation expectations in the Eurozone, while the blue line above tracks inflation expectations in the U.S. As you can see, the blue line has moved sharply higher, while the green line has delivered a modest uptick. Thus, rising Eurozone interest rates remain extremely unlikely.
In conclusion, fundamental headwinds continue to shake the EUR/USD. And despite bouncing over the last two trading days (after declining for six of the previous seven), the fundamental divergence should catch up to the currency pair over the medium-term. Moreover, given its significant influence over the USD Index, a material decline in the EUR/USD should propel the basket back above 94.5. As a result, the PMs strong negative correlation with the USD Index clouds their medium-term outlook. For now, though, we still have time to enjoy the PMs short-term upswing.
Disclaimer: All essays, research, and information found on the Website represent the analyses and opinions of Mr. Radomski and Sunshine Profits' associates only. As such, it may prove wrong ...
more


ECB buying down rates means Fed free to do the same w/o harming bond demand. Lower world wide bond rates is good for Gold. All eyes on Fed next week.
We'll see. So far, the markets were expecting another Operation Twist and they didn't get it (and gold declined in the aftermath).