

Image Source: Pixabay
The "turn of the month" effect has frequently been studied in relation to the U.S. stock markets. It shows that stocks tend to rise more around the turn of the month than around the middle of the month.
The context to this pattern is that regular income from salaries is received at this time. This is then invested on the stock market around the turn of the month via saving plans.
But what about other stock markets, and commodities?
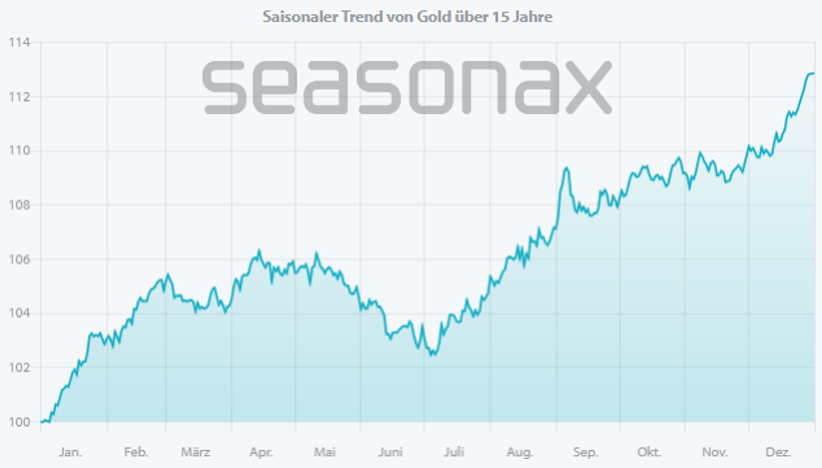
Mean trend of the gold price 10 trading days before and after the start of the month (1998 to 2023)

Gold rises particularly strongly in the two days before. Source: Seasonax
As you can see, gold rises particularly strongly at the turn of the month. Over these days, the annualized return has almost been 32 percent, while gold itself only gained less than eight percent on average.
You can now quickly analyze the "Turn of the Month" effect in Seasonax in detail by marking the two days as usual (see arrows). Since the line already represents the "1st Day of the Month", it is the period from the close of the month to the second day of the following month (or the following trading day).
On the right, you will then see the evaluation with important key figures, such as the annualized return or the hit rate ("winning trades"). Below you will find other diagrams and detailed statistics.
Now look at the capital yield curve ("cumulative profit") here:
Gold: Capital Yield Curve of the "1st Day of the Month" Event

The event defied the gold bear market. Source: Seasonax
You can see that the effect has only been around since 2006. When evaluating, keep in mind that gold was in a bear market after 2011. Since mid-2020, the gold price has only run sideways, while the yield curve has risen.
So the effect in gold is there, but it's not strong.
There are stronger ones, for example, the Indian stock index Nifty 50, which has had a very large "Turn of the Month" effect for 20 years.
But I don't want to give too much away. After all, with just a few clicks of the mouse, you can now investigate the "Turn of the Month" effect in detail for yourself. This is not only for gold, but also for Stocks, indices, currencies and commodities - in other words, for over 20,000 instruments.
More By This Author:
Event Study: How Do Key Interest Rate Hikes Affect Stock Prices?
Gold And Metals Under The Seasonal Magnifying Glass
A Seasonal Increase Is In Store For Silver

Comments
Log in or sign up to join the conversation.