
How Can We Explain The Drop In Gold And Silver Prices?
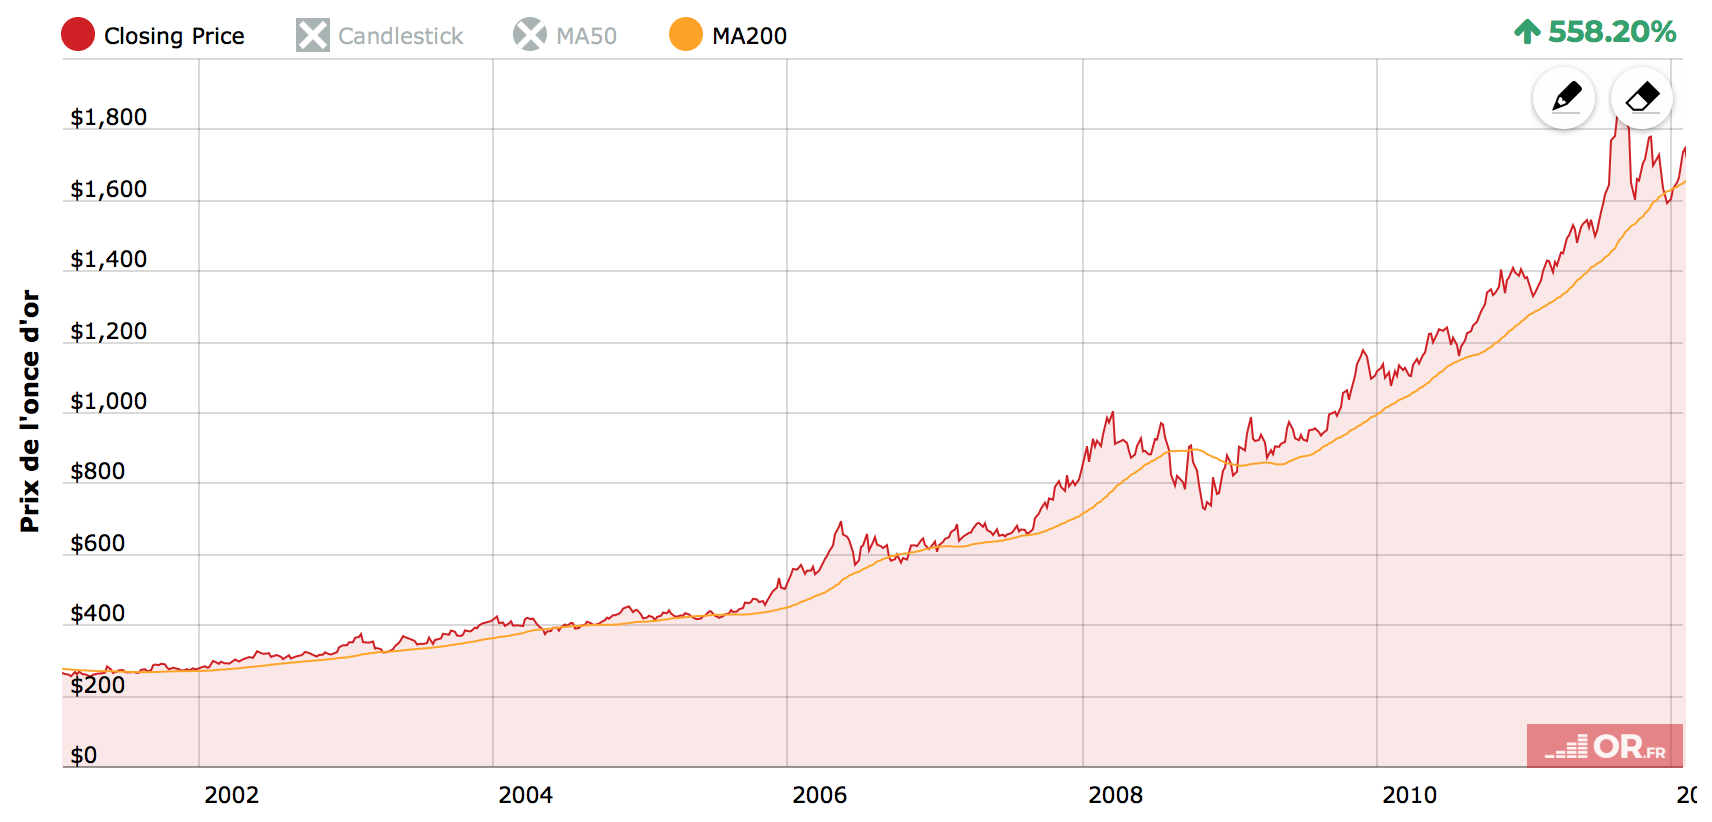
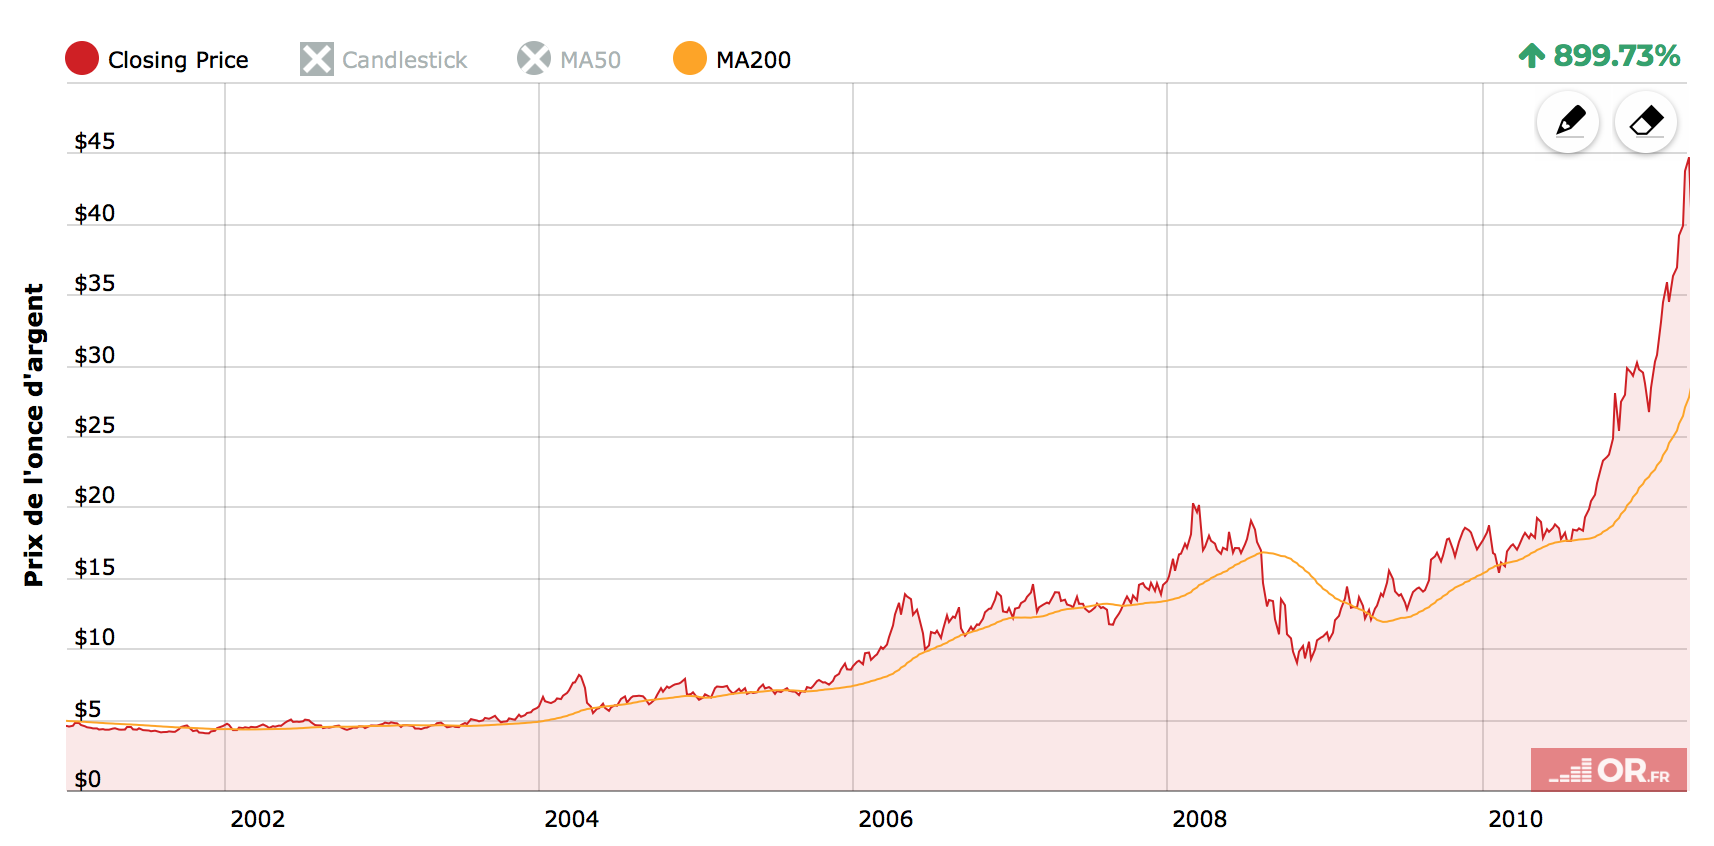
In a bull market, there are systematically corrections of around -20% on gold and -30% on silver. The last bull market from 2001 to 2011 was no exception to this rule, as can be seen in the chart below.
These corrections did not prevent gold and silver from achieving a performance of +558% and +899%, respectively, over this period.
These drops have nothing to do with fundamentals, which have generated a new bull market since December 2015 but are linked to cycles and phases of excessive optimism. A market does not rise vertically without ever falling. These corrections help to calm excessive optimism.
Let's take a simple example to better understand the bull markets dynamics: imagine a construction whose foundations do not rest on a sufficiently wide and solid base, but on the contrary: on a narrow, fragile, and vertical scaffolding. What are the chances of building a 100-story building on such a fragile base? None. A building of this type is built in stages (bases) allowing for the progressive development of the building in order to reach the intended height. It's the same thing in the high mountains: you don't climb directly to the top of Everest; it takes weeks of approach and then stopping at five different camps, and very often going back down (corrections) to acclimatize, before reaching the summit.
The same applies to bull markets. Different phases follow one another: base, rise, consolidation, drop, new base, etc.
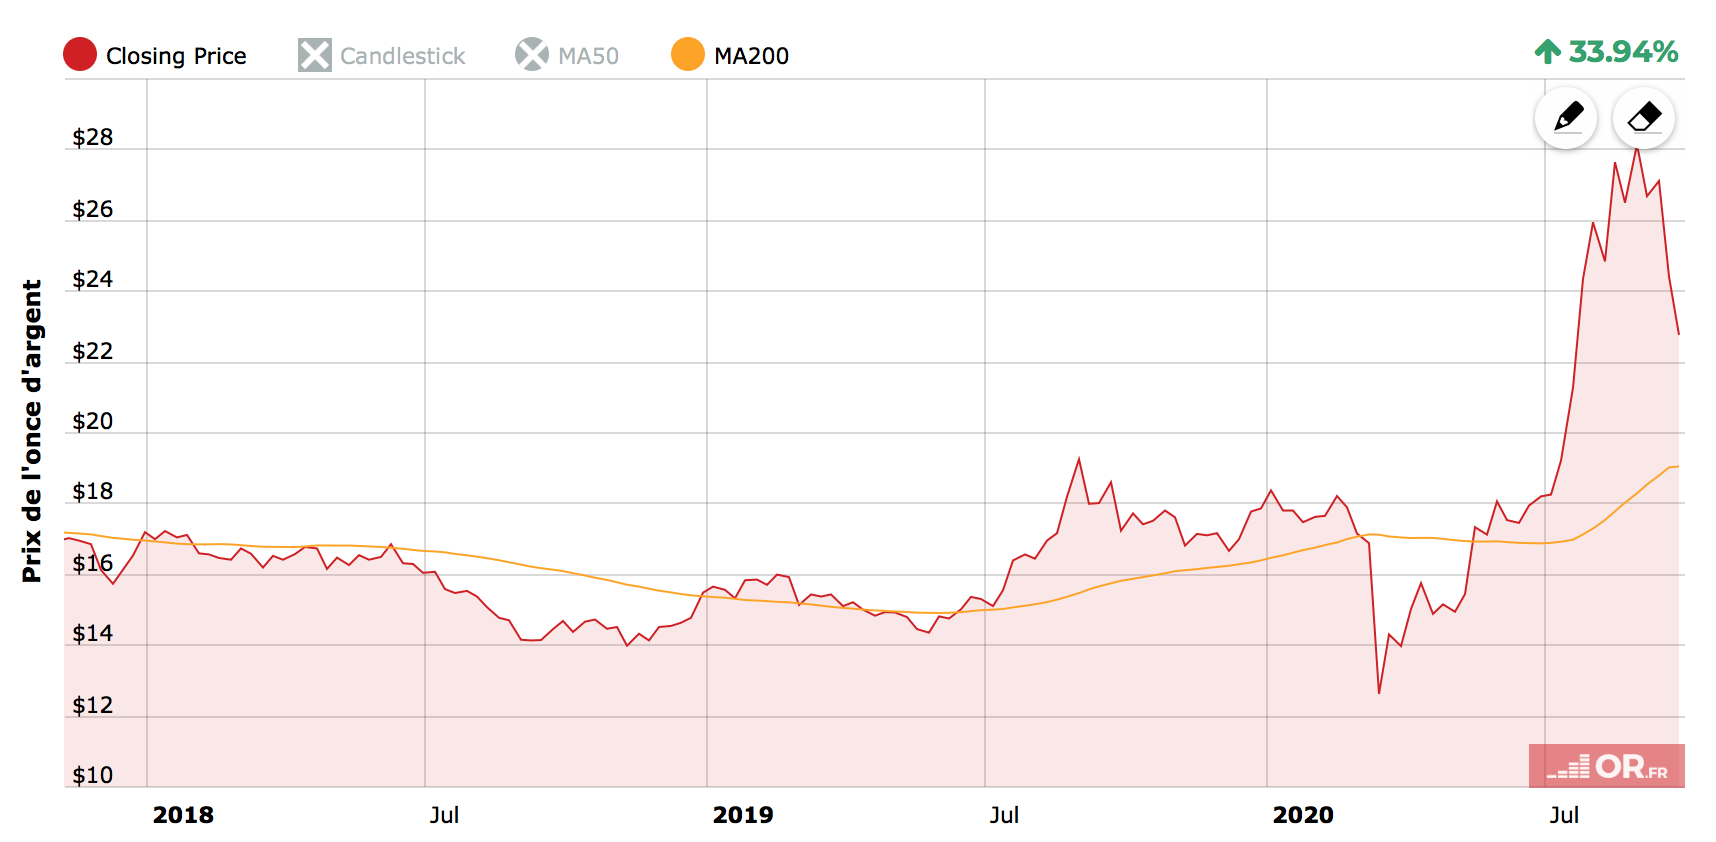
Metals strong performance in recent months has generated a euphoria phase. As can be seen in the chart below, gold and silver prices have risen in an almost parabolic manner, which is not sustainable to reach much higher levels, as I announced in a Tweet on August 11th.
wouldn t be surprised if #silver correct back to 20/21$ #healthycorrection #bullmarket #sentiment #cycles https://t.co/LNBqhUuh6M
— Fabrice Drouin Ristori (@FabriceDrouin) August 11, 2020
Parabolic rise
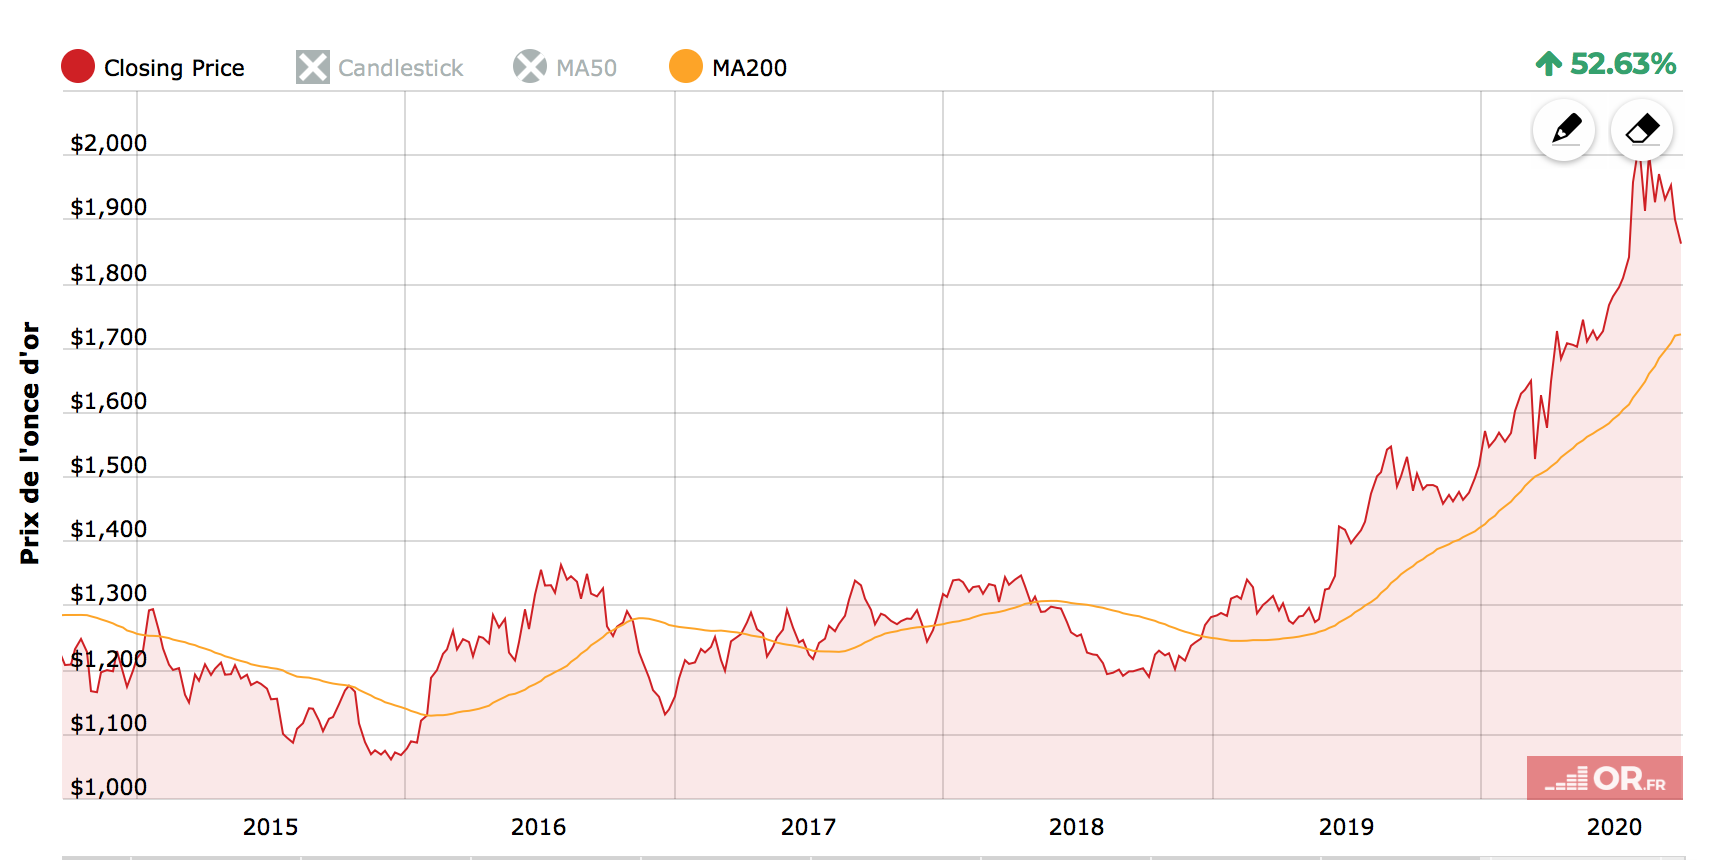
The base of a bull market is generally around the 200-day moving average. This indicator is dynamic and progresses with the evolution of the spot price. Each return to this base is healthy and helps gather strength to fuel the next bull phase. To date, the 200-day moving average is $1720 for gold. It is possible that it may be broken temporarily, but again, not for fundamental reasons but for reasons of excessive sentiment. The markets go from euphoria to fear, causing excessive movement, then things calm down and fundamentals regain the upper hand.
In conclusion, this correction is healthy and offers a new investment opportunity before the next upward phase. To consider that the bull market would end with this correction would be tantamount to believing that central banks and governments will stop their monetary printing policies and let rates rise, which is perfectly impossible in the current context.
Disclosure: GoldBroker.com, all rights reserved


