
History Rhymes: Does USDX’s Uprising Mean Gold’s Climax?
The yellow metal’s behavior looks more bearish now than it did in 2017-2018. The USDX has a lot of bullets in its chamber, and gold can be riddled with them.
Plenty of warning signs on the near-term horizon: The USDX is after a long-tern breakout, traders are reducing net-short positions, and the slightest shift in U.S. dollar sentiment can lead the rest of the herd to follow. If a USDX resurgence is combined with an equity shock, then the precious metals are in for trouble.
Last Friday (Mar. 12), we focused quite a bit on the moves in the gold miners and how their related ETFs (GDX and GDXJ) are faring and which will suffer most during the next phase of the decline. We also touched on this subject last Wednesday as well. It was important to shed light on the miners because they’ve been leading the charge in the corrective upswing. I also wanted to explain the Eurozone’s impact on the precious metals and how crucial it is to examine the bigger picture and how the pieces are all connected. Today, let’s shift our attention over to the currency perspective, namely the USDX.
The price shape and time analogies are truly remarkable right now. It’s quite often the case that history rhymes, but it’s rare for it to rhyme so closely and clearly to what we now see in the case of the USD Index. And the implications for precious metals investors are profound.
On Mar. 8, I warned that with the USD Index confronting its mid-2020 lows (resistance), a short-term dip could occur in the coming days. But after declining by 0.34% last week, the negativity could be short-lived.
Case in point: the 2017-2018 analogue is already in full swing, and while short-term dips were part of the historical journey, the USDX could be about to exit its consolidation phase.
Please see below:
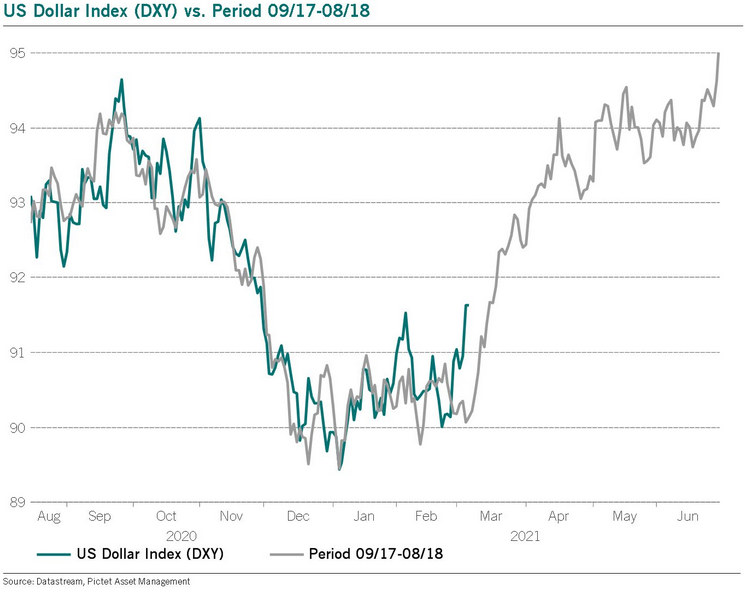
You can also see the similarity between two periods and the technical patterns that they included in the chart below:
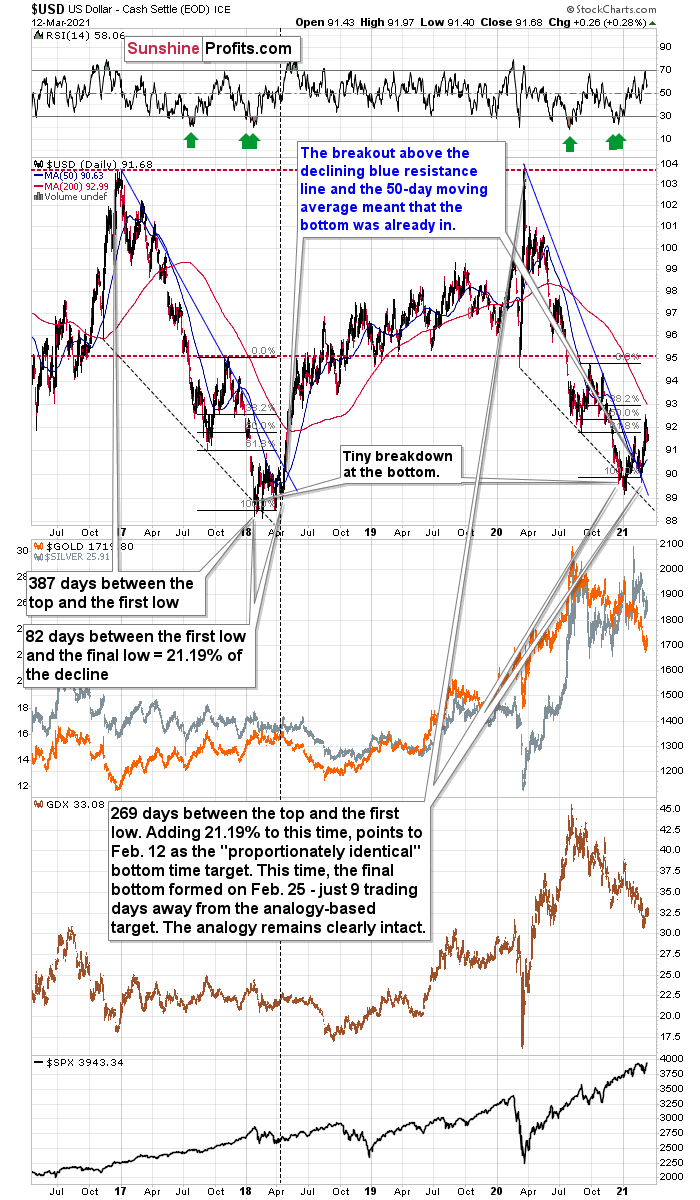
Even while looking at the price moves for just a second, the size and shape of the 2017-2018 analogue clearly mirrors the 2020-current price action. Although this time, it took less than 118 days for the USD Index to move from peak to trough.
In 2017-2018, it also took 82 days for the USDX to form a final bottom (the number of days between the initial bottom and the final bottom) and the duration amounts to 21.19% of the overall timeframe. If we applied a similar timeframe to today’s move, then the USD Index should have bottomed on Feb. 12. It actually bottomed (finally) on Feb. 25, which was just 8 trading days away from the former date. Taking into account the sizes of the moves that preceded the previous declines (they took approximately one year to complete), this is extremely close and an excellent confirmation that the self-similar pattern remains intact.
In addition, as the USDX approached its final bottom in 2017-2018, gold traded sideways. Today, however, gold has been in a downward spiral. From a medium-term perspective, the yellow metal’s behavior is actually more bearish than it was in 2017-2018.
Finally, the USD Index’s breakout above its 50-day moving average (which it still holds today) is exactly what added gasoline to the USDX’s 2018 fire. Case in point: after the 2018 breakout, the USDX surged back to its previous high. Today, that level is roughly 94.5.
Moreover, gold’s trepidation alongside the USD Index strength on Mar. 12 adds even more validity to the 2017-2018 analogy.
I wrote on Mar. 10:
It’s not true that there were no pullbacks during the 2018 rally. There were, but they were simply too small to be visible from the long-term point of view.
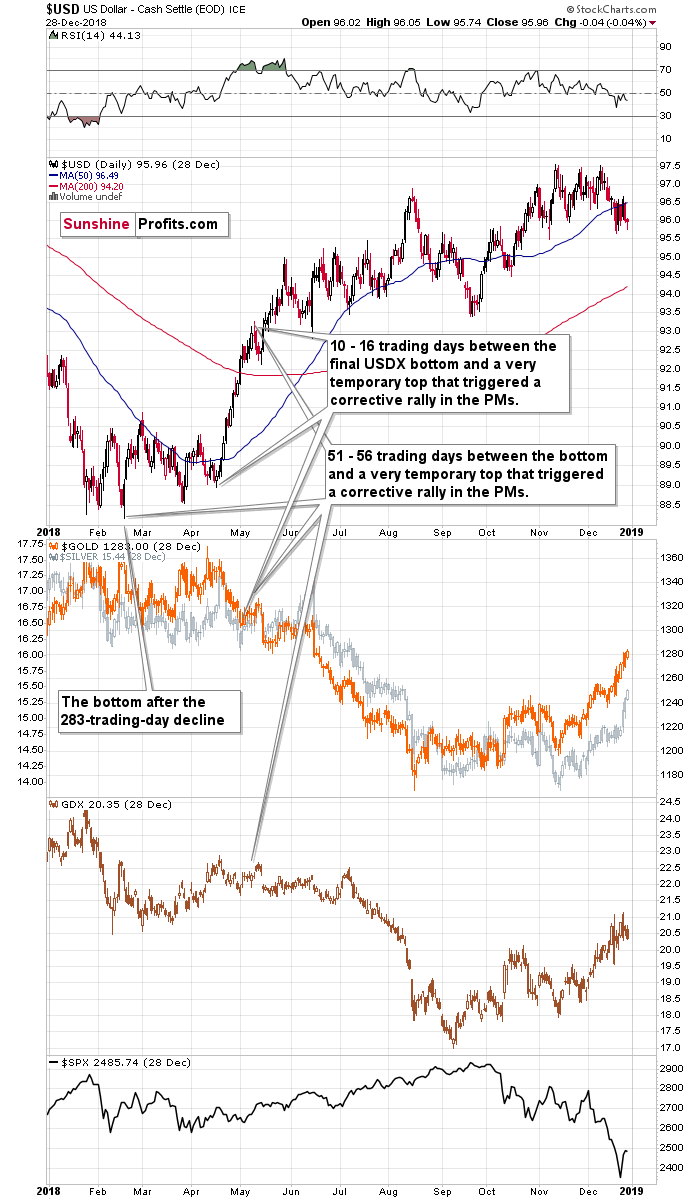
The first notable pullback took place in early May 2018, and it contributed to a corrective upswing in the precious metals market. To be precise, the USD Index declined after rallying for 56 trading days, but gold rallied earlier – 51 trading days after the USD Index’s final bottom. The USDX’s immediate-top formed 16 trading days after its final bottom, and gold’s bottom formed 10 trading days after the USD’s final bottom.
Comparing this to the size of the previous decline in terms of the trading days, it was:
- 51 – 56 trading days / 283 trading days = 18.02% - 19.79%
- 10 – 16 trading days / 283 trading days = 3.53% - 5.65%
More importantly though, when the USD Index turned a short-term decline into consolidation in mid-2018, gold’s hesitant reaction highlighted the yellow metal’s anxiety. And what followed? Well, gold’s next move was significantly lower, while the USD Index’s next move was significantly higher. This means that it was likely a good idea that we took profits from our long positions recently when the GDX moved to $32.96 (opening at $30.80 - $31).
Please see below:
In addition, if we analyze the pairs’ very recent price action, it’s a splitting image.
On Friday (Mar. 12), the USD Index rallied by 0.28%, while gold was (roughly) directionless despite the intraday volatility. And just like in 2017-2018, the yellow metal’s behavior signals a forthcoming climax. As a result, gold and the USD Index are behaving exactly as they did before going their separate ways in 2017-2018. And this means a bearish gold price prediction for the following weeks (not necessarily hours, though).
Please see below:
To explain, I wrote on Mar. 10:
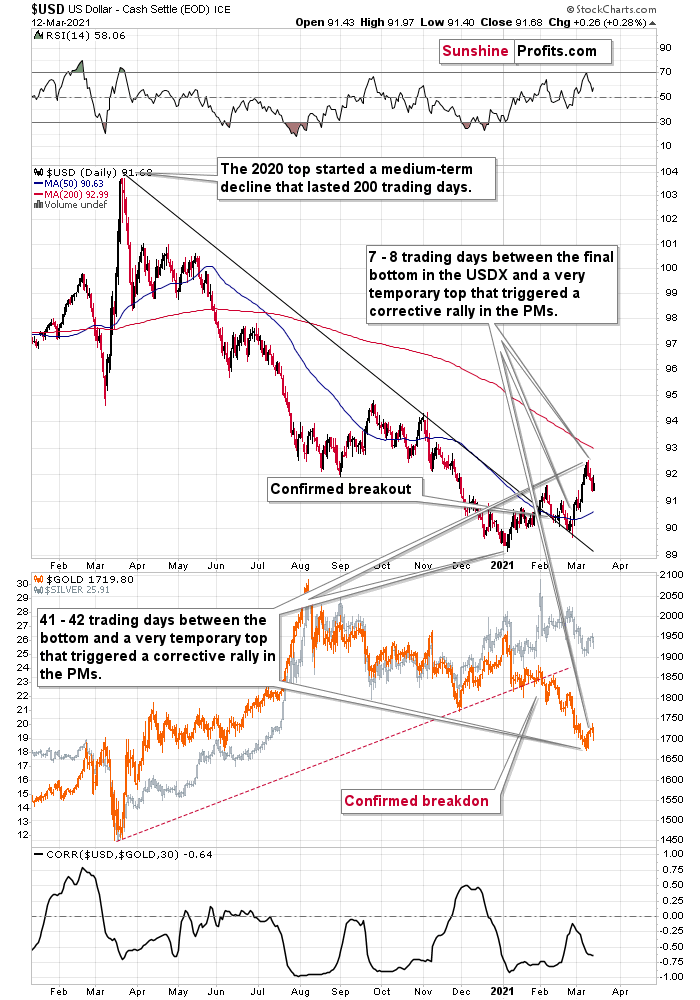
Let’s examine the current situation: the preceding decline lasted for 200 trading days and there were 41 – 42 trading days between the final USDX bottom and the short-term reversals in gold and USDX. Comparing this to the final USDX bottom, we get 7 – 8 trading days.
Applying the previous percentages to the length of the most recent medium-term decline in the USD Index provides us with the following:
- 18.02% - 19.79% x 200 trading days = ~36 - ~40 trading days
- 3.53% - 5.65% x 200 trading days = ~7 - ~11 trading days
The above estimation of about 36 – 40 trading days almost perfectly fits the current 41 – 42-day delay, and the estimation of about 7 – 11 trading days almost perfectly fits the current delay of 7 – 8 trading days.
In other words, the analogy to the 2018 performance does not only remain intact – it actually perfectly confirms the validity of the current corrective upswing. Once again, it’s very likely just a pullback, not a big trend reversal.
The bottom line?
Given the size of the 2018 upswing, 94.5 on the USD Index is likely the first, of many, potential upside targets.
Adding to the list of upside catalysts, the USD Index still has plenty of other bullets in its chamber. For instance, we’re also in the early innings of a shift in U.S. dollar sentiment. With short interest hitting an all-time high in late-2020, it was a complete fire sale. Today, however, short interest may have peaked.
Please see the below chart based on the CoT report:
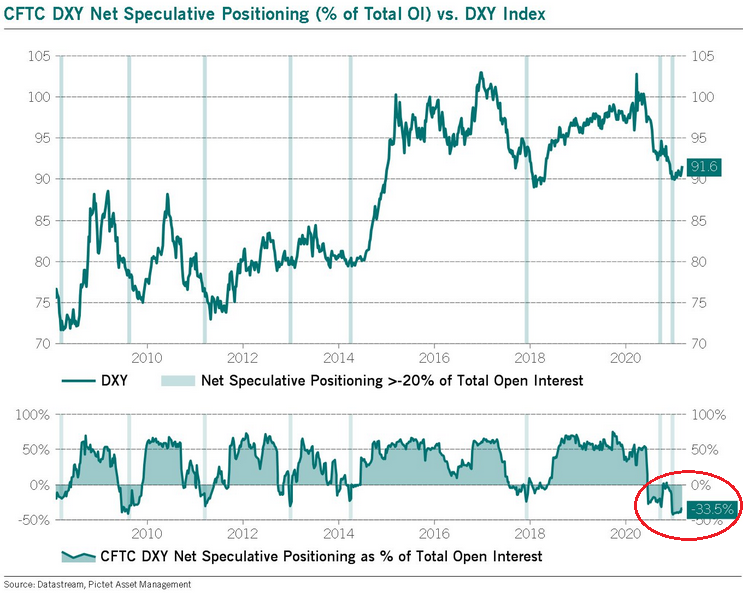
Please consider how big rallies followed the moments when the net speculative position as % of total open interest started to rally back up after being oversold for months. The situation here is still more extreme than it was in early 2018 and 2014, suggesting that the upcoming rally might be bigger than the ones that we saw then.
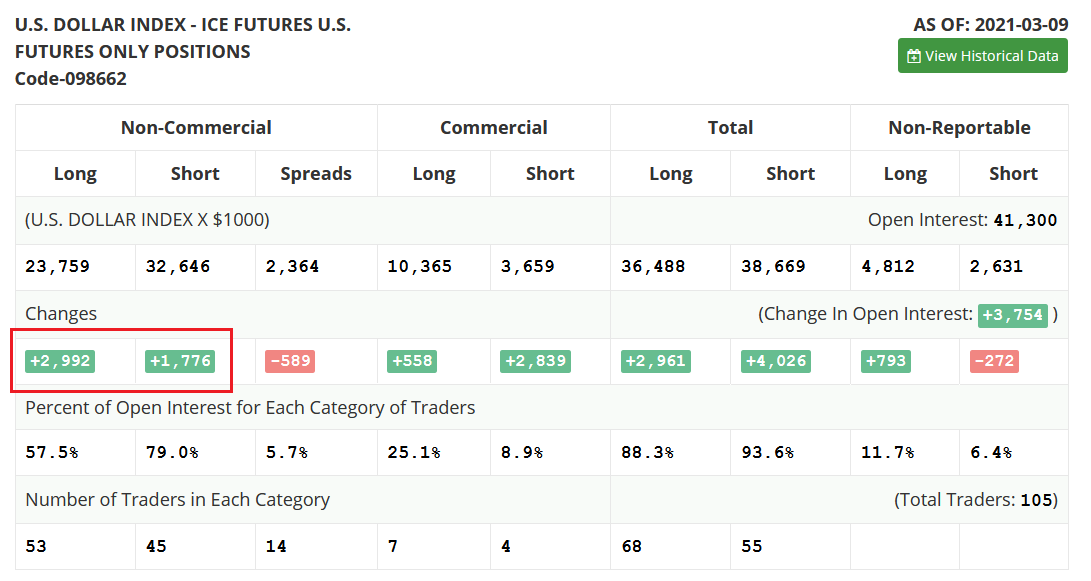
As further evidence, speculative futures traders (non-commercial) actually reduced their net-short positions by 1,216 contracts last week (the net of the two values in the red box below). As a result, the slightest shift in sentiment could lead the rest of the herd to follow.
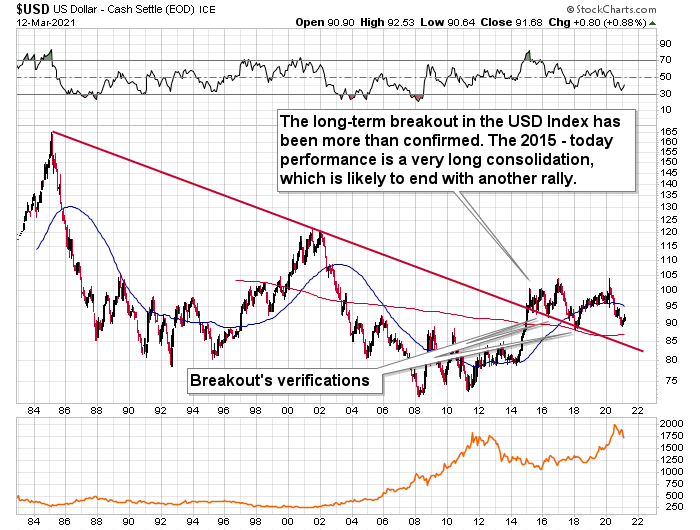
Finally, let’s not forget that the USD Index is after a long-term, more-than-confirmed breakout. This means that the long-term trend for the U.S. dollar is up.
In conclusion, the USD Index is likely shifting from consolidation to ascension. With the size, scope, and duration of the recent price action mirroring 2017-2018, it’s only a matter of time before the USD Index’s medium-term breakout gives way to a material breakthrough. What’s more, the USD Index is finally reacting to the rise in U.S. Treasury yields. Initially ignoring the late-2020 surge, a bottom, and subsequent rally in the U.S. 10-Year Treasury yield has lifted the USD Index 80% of the time since 2003. And with the relationship seemingly restored in 2021, the combination is profoundly bearish for the PMs, especially given today’s triangle-vertex-based reversal in gold.
Disclaimer: All essays, research, and information found on the Website represent the analyses and opinions of Mr. Radomski and Sunshine Profits' associates only. As such, it may prove wrong ...
more


I don't think the USD's bottom is in with this cycle. I Think that we should use price and time when comparing thses two cycles. USD's 2017/18 down and base cycle was much longer than your currently defined 2019/2020 cycle. USD in 2017/18 took her time retesting the steep downward channel she broke in Oct 2018, before basing and finally moving up and out in April 2018. 50 MA was falsely breached in Oct 2017. Don't think the break of this MA confirms a bottom. If we are comparing I see the Oct 17 countertrend rally being similar to the Feb 2021 swing up. We shall see.
The base was longer in 2017-2018, but so was the preceding decline - they were proportional. But as you wrote, we'll see.