
Historic Decline In Gold And Silver Prices Amid Stock Market Uncertainty
Friday, January 30, 2026, will go down as a landmark date in the gold and silver markets. Both metals recorded their sharpest daily swing since at least the 1980s, bringing several weeks of intense speculation to an abrupt end.
What happened, how can such a movement be explained, and what does it reveal about the outlook for the stock markets?
- Gold closed down more than 8%, while silver fell more than 25%, illustrating a violent unwinding of speculative positions.
- Despite this sharp correction, both metals are still showing a clearly positive performance since the beginning of the year, with gold up 12.5% and silver up nearly 60%.
- The explosion in volatility forced COMEX to raise margin requirements, while the price gap with Asian markets widened significantly.
- The simultaneous rebound in the dollar and oil prices, combined with increased uncertainty in the equity markets, suggests a pause in the prevailing optimism and a renewed caution among investors regarding global risk.
The most turbulent speculative movement in at least 40 years
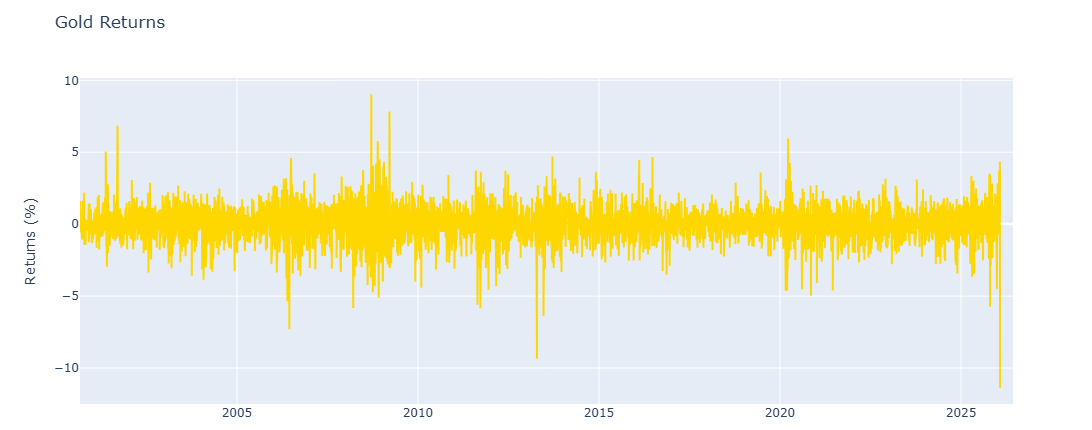
Data source: yfinance
On Friday, January 30, the price of gold fell dramatically by 8.25%, closing at around $4,879 per ounce on the COMEX. During trading, the decline even reached 12.5%.
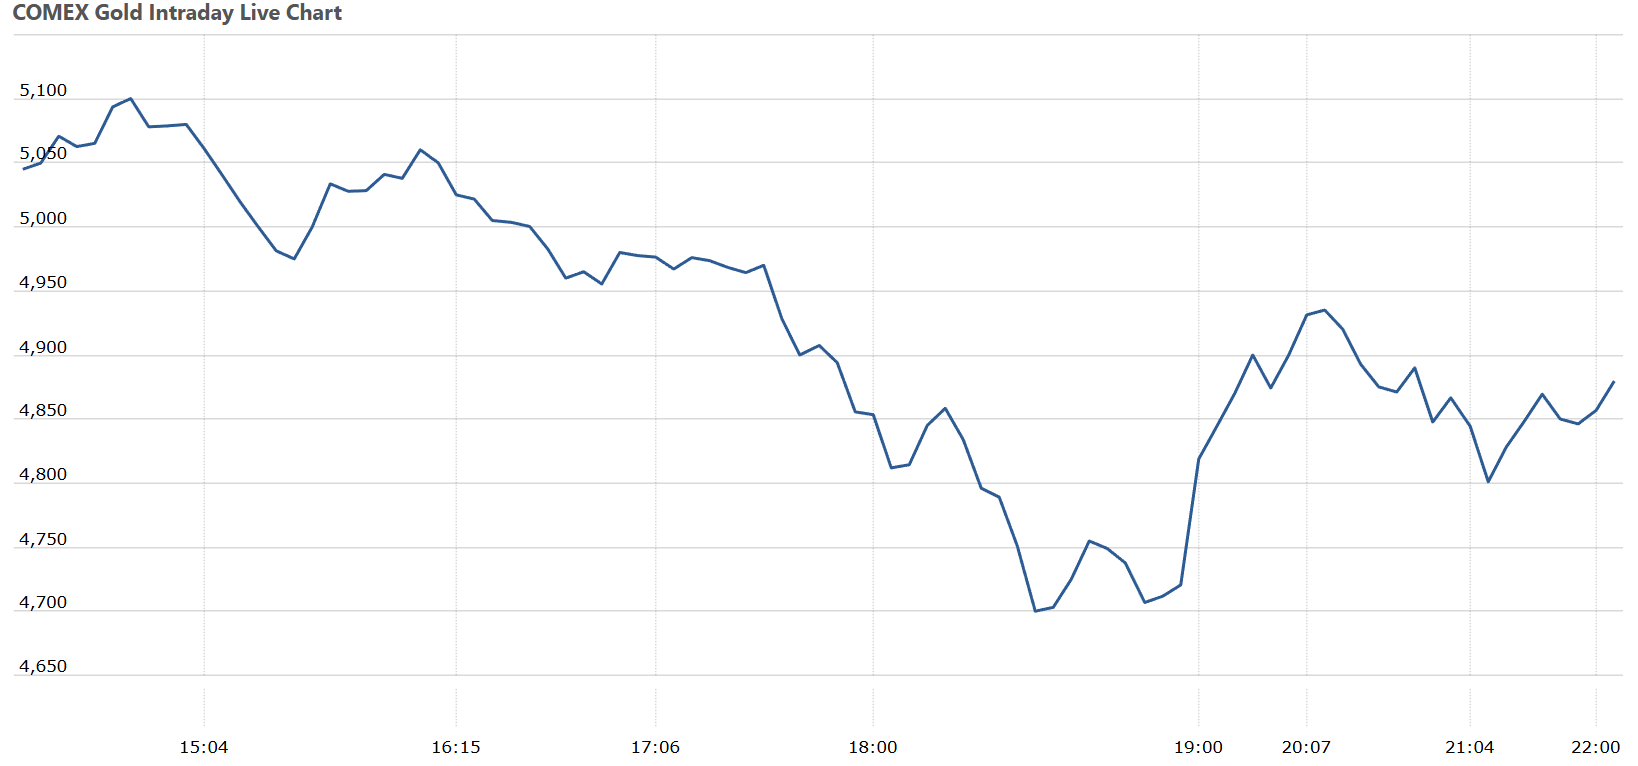
Source: Comex Gold | Live Quotes, Prices, Charts, News | COMEX Live
Silver suffered an even more extreme decline. The metal fell by 25.5%, returning to around $85 per ounce on COMEX, with an intraday low of close to $74. This session represents the largest intraday movement ever recorded for silver. However, history is repeating itself: the scale of the decline is very similar to that seen on May 2, 2011, and we have to go back to the famous debacle of March 1980 to find a comparable collapse. Despite this, silver has still posted an exceptional performance of +59% since the beginning of the year.
When prices fall so rapidly, institutional investors who have sold options find themselves in a “short gamma” position. To remain delta-neutral, they are then forced to sell the underlying asset as prices fall. This mechanism triggers a cascade of sales. This is a classic dynamic after a period of euphoric growth.
In terms of market capitalization, gold and silver together lost more than $10 trillion in a matter of hours. And yet, in terms of the structural revaluation of precious metals, this correction appears to be more healthy than dangerous.
Dollar rebound, speculation, and stock market uncertainty
The movement observed can be explained by a combination of several factors.
- Donald Trump's announcement of his intention to appoint Kevin Warsh as head of the Federal Reserve contributed to a rebound in the dollar, despite the seemingly accommodative nature of the chosen profile.
- Expectations surrounding monetary policy were also accompanied by a rebound in oil prices and the risk of an increase in real interest rates.
- Stock market uncertainty is growing, with major indices plateauing, midterm elections approaching, and corrections in certain iconic stocks such as Microsoft.
- Finally, the continued decline in cryptocurrencies over the past several weeks reflects a weakening of overall bullish sentiment in the markets.
The main trigger, however, appears to be the movement of the dollar. The rebound observed on Friday, January 30, followed President Donald Trump's announcement of Kevin Warsh's nomination to succeed Jerome Powell as head of the Fed. Kevin Warsh is known for his stance in favor of rate cuts, in line with the administration's desire to exert increased pressure on the central bank.
However, financial markets anticipate that he could preserve the institution's independence and adopt a more conservative stance, similar to his position between 2006 and 2011. This interpretation has supported the dollar, with a sharp decline in the EURUSD, which fell from around 1.208 on Tuesday, January 27, to 1.185 on Friday, a drop of nearly 2%.
This strengthening of the dollar was accompanied by a sharp rebound in oil prices. WTI rose by around 7% over the past week, a move also fueled by expectations of US strikes on Iran, which are contributing to increased tensions over energy supplies.
Who drives metal prices?
For over a year, the evolution of the gold price has been driven mainly by financial investors. These include both investors via ETFs, whose cumulative demand was close to 800 tons in 2025, and professional investors active in the derivatives markets. Analysis of open contracts also shows a gradual decline in speculative positions since October, suggesting that the previous upward momentum is running out of steam.
Looking at the evolution of open interest, i.e., the number of futures and options contracts still open, it has certainly increased since the end of December, but seems to have plateaued since Monday, January 26, signaling a possible disengagement by some investors. Over a longer horizon, it is also notable that open interest remains below its January 2025 peak of around 575,000 open futures contracts. Finally, in both the gold and silver markets, the four main players alone account for nearly a third of all open contracts.
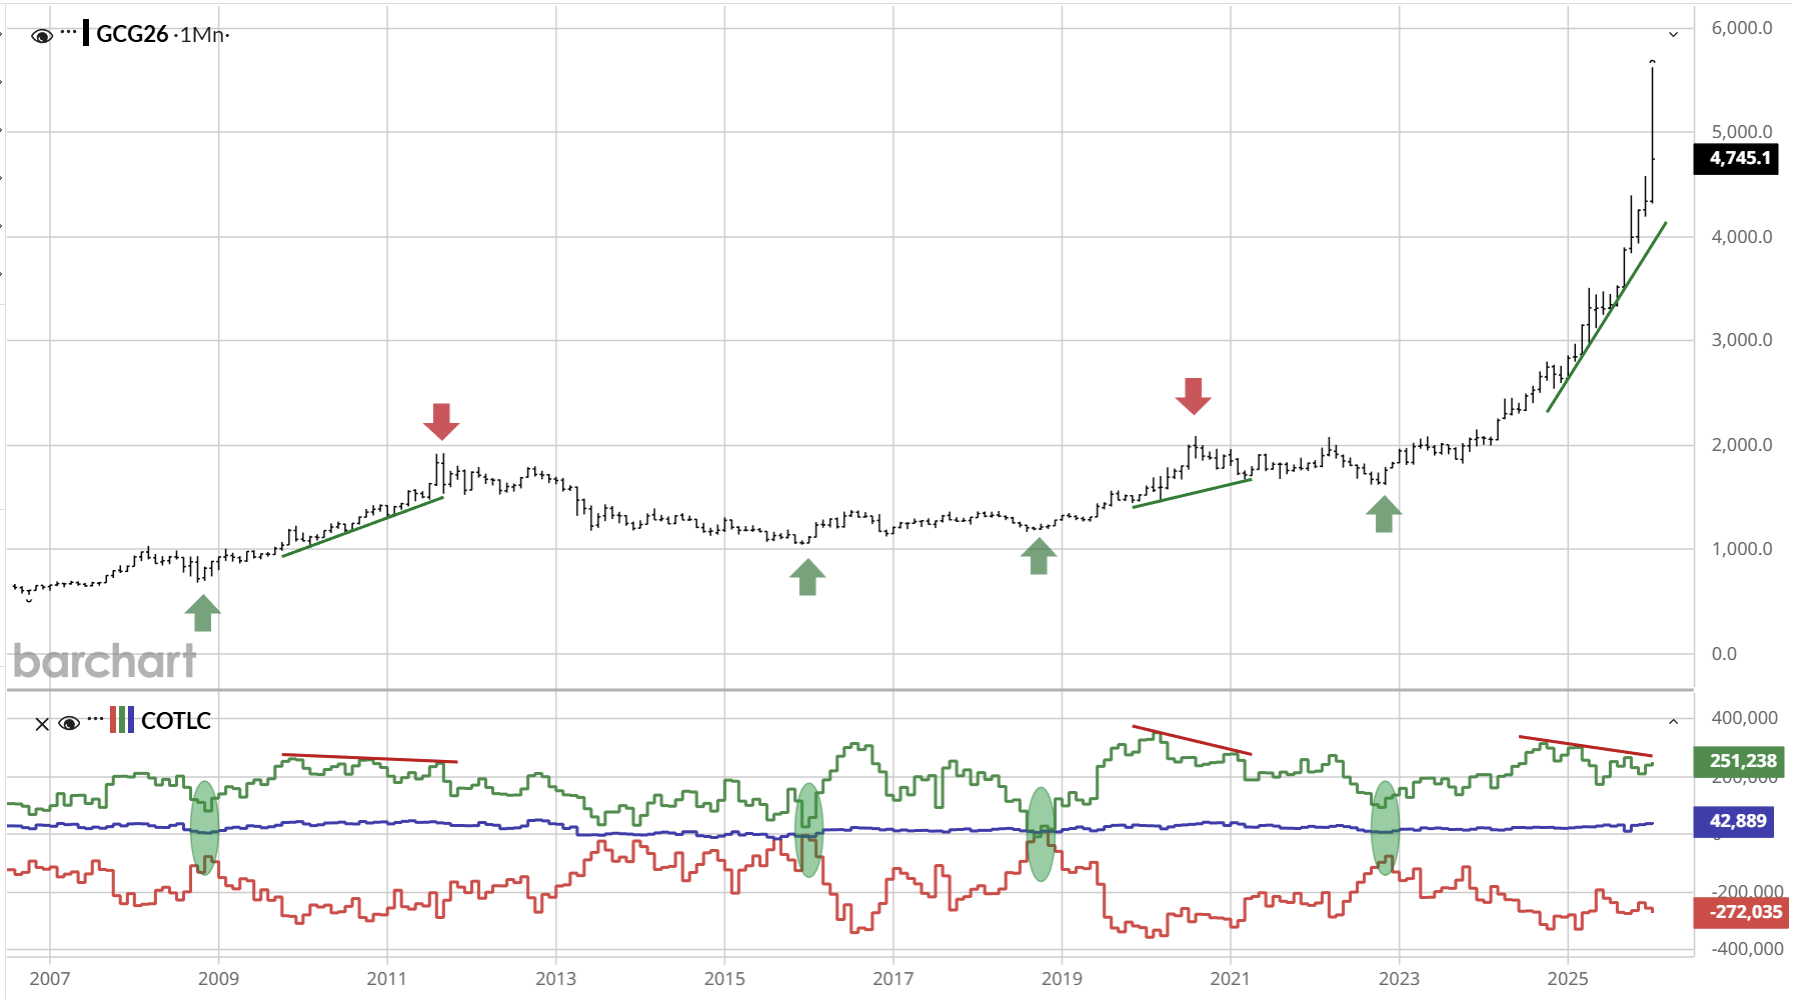
Source: Barchart | Market Data, News, Trading Tools, and Analysis
Finally, trader engagement highlights sustained interest from speculators and asset managers until October 2025 (green curve). However, these players began to lose interest from October onwards, reflecting a classic divergence pattern near the peak of the gold price, as already observed during the peaks of 2011 and 2020.
At the same time, there has been a marked increase in open positions held by small speculators (blue curve), which now stand at nearly 43,000 contracts. Faced with this buying pressure, gold producers and traders remain structurally positioned to sell (red curve).
A historic spread with Shanghai
In a highly volatile environment, gold and silver prices showed a historic divergence with the Shanghai market. For example, at the close of trading in Shanghai on Friday, gold was trading at around $5,250 per ounce, compared with around $4,900 per ounce at the close of trading on COMEX. After the close of trading, the premium between the two markets widened further, reaching as much as $32, driven by sustained demand from Chinese investors.
Silver is also experiencing an unusual price difference of around $10 per ounce, compounded by the effect of different closing times between markets. Although delivery terms differ from one market to another, this situation highlights the market's difficulty in adjusting quickly in an environment of extreme stress and volatility.
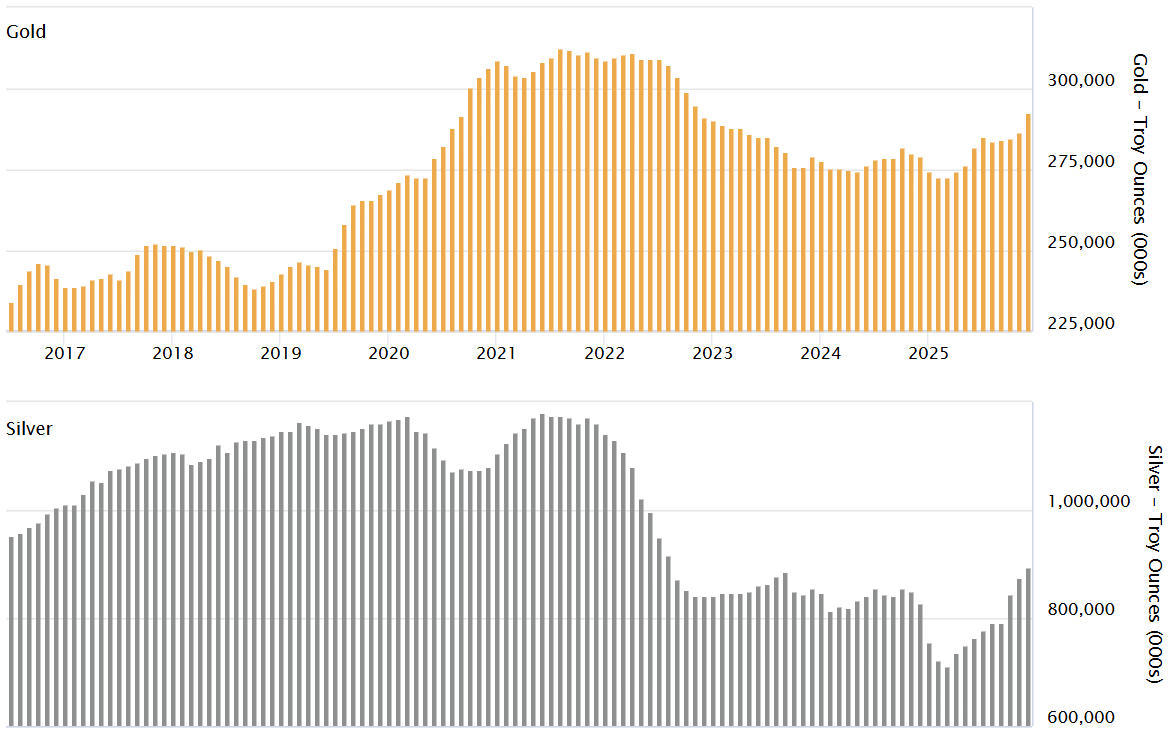
Source: London Vault Data | LBMA
In London, gold and silver stocks show a slight improvement compared to the beginning of the year. However, given the scale of recent movements, these levels remain historically low. To date, the London market has around 9,000 tons of gold and nearly 28,000 tons of silver in its vaults.
The severity of price fluctuations has reignited debate among some about possible market “manipulation.” In 2020, JP Morgan agreed to pay a fine of nearly $1 billion for proven manipulation practices involving precious metals between 2008 and 2016. For example, on the COMEX, JP Morgan is both one of the main suppliers and one of the main buyers of metal, as shown in the latest delivery report.
Finally, it should be noted that less than 10% of open contracts on gold and silver result in actual delivery, highlighting the dominant role of the derivatives market in price formation, to the detriment of physical settlement. In fact, we are even seeing a reduction in silver deliveries, while gold deliveries remain stable.
Extreme volatility of gold and silver
The historical volatility of gold has exceeded its March 2020 peak, reaching over 48%. The previous peak was in October 2008, at nearly 54%. Such levels of volatility in gold are traditionally observed during periods of systemic crisis, which are generally accompanied by continued upward momentum. However, the absence of an immediate macroeconomic shock suggests above all the power of the speculative movement currently at work.
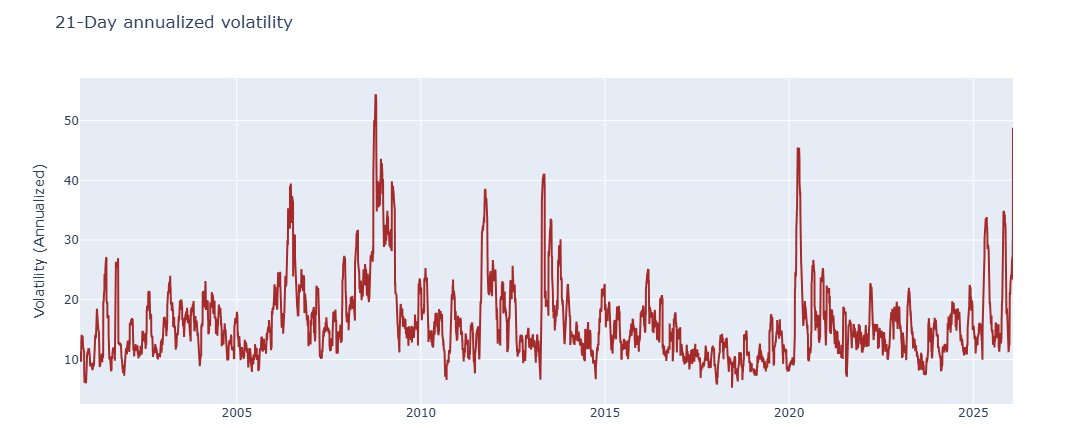
Data source: yfinance
The situation is even more pronounced with silver. Its volatility now stands at around 150%, a level not seen since at least the 1980s. By way of comparison, it stood at 85% in April 2020 and 95% in October 2008. Such volatility now exceeds that of many cryptocurrencies, highlighting the exceptional nature of the movements observed in the metal.
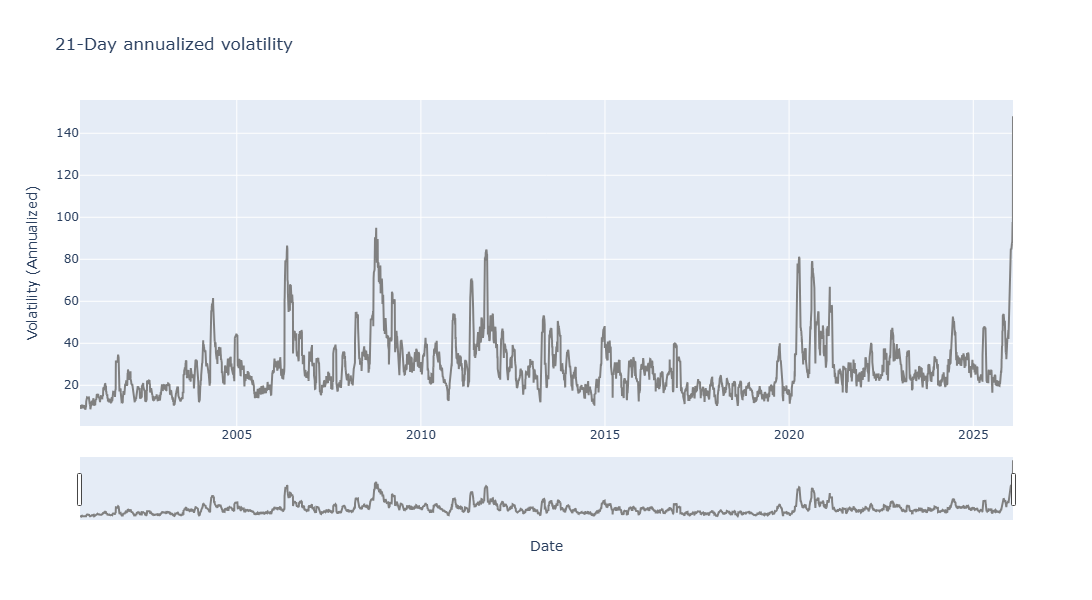
Data source: yfinance
This highly unstable environment has led the CME, which lists metal futures contracts, to significantly raise initial margins. These initial margins, which are required to open a futures contract, are intended to protect the market against default risks. Their rapid adjustment is a key indicator for assessing investors' ability to maintain their positions despite the increase in the cost of leverage.
In a press release published on Friday, the CME announced a further increase in initial margins on gold, from 6.6% to 8.8%, or $42,240 at Friday's gold price for a 100-ounce futures contract. Initial margins on silver would be raised from 11% to 15%, further increasing pressure on the most exposed operators.
After metals, a risk of contagion to indices?
The correction observed in precious metals, combined with the rebound in oil and the dollar, is beginning to exert noticeable pressure on equity markets. The S&P 500 is still trading close to its all-time highs, but the upward momentum has also been showing signs of slowing since October. Despite increased volatility in other asset classes, the S&P 500 Volatility Index (VIX) remains below 20, reflecting a certain complacency in the market.
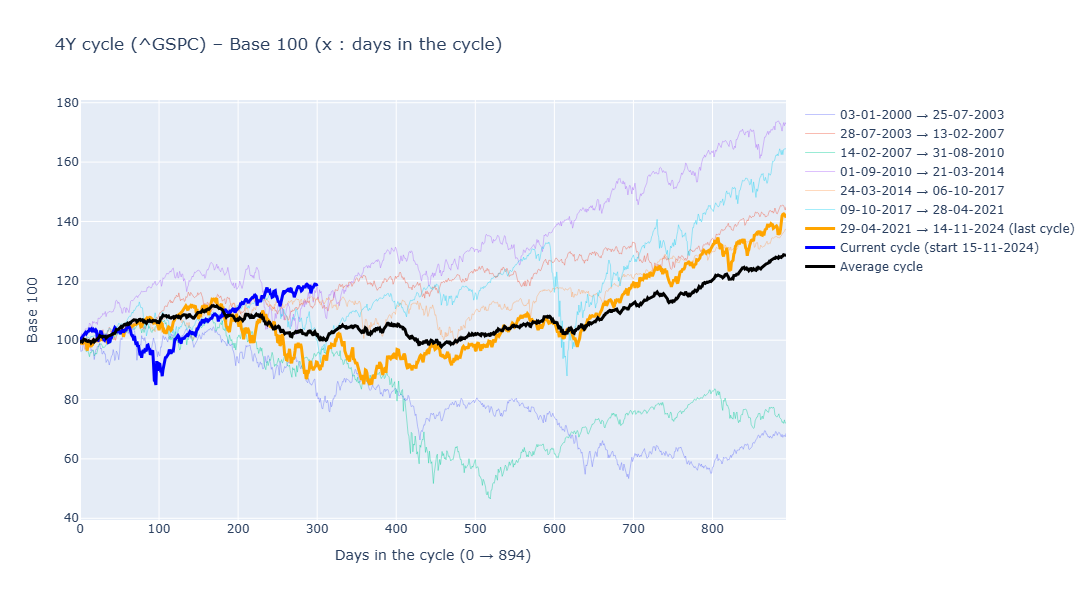
Cyclical analysis of the stock markets reinforces this interpretation. The current bull market, which began in early 2023, has now been going on for nearly three years. The consolidation phase observed last April certainly helped to revive the trend, but several cyclical indicators, notably the US presidential cycle as the midterm elections approach (see below) and the Kitchin cycle, suggest that a period of consolidation could be necessary in 2026. Without such an adjustment, the indices could enter a prolonged phase of overvaluation, increasing medium- and long-term vulnerabilities.
Cryptocurrencies struggle to rebound
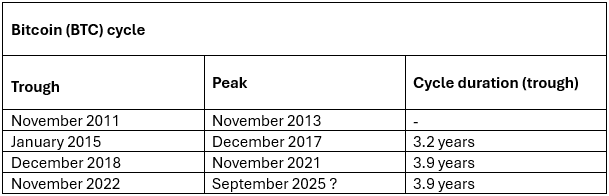
This trend is even more pronounced for bitcoin (BTC), which has fallen by more than 34% since its peak of around $126,000. A continuation of the downward trend could therefore call into question the strength of the current bull market.
Considering that the last bull cycle began around November 2022, bitcoin would now be in an upward phase of around 1,160 days, which is already well advanced compared to the peaks observed in previous cycles.
Consequently, the stagnation observed in bitcoin over the past three months warrants particular attention. Bitcoin is a leading indicator of liquidity and overall confidence in financial markets.
Finally, it is worth noting the success of gold-backed cryptocurrencies such as Pax Gold and Tether Gold, whose outstanding amounts have grown in tandem with downturns in the cryptocurrency market.
Conclusion
Several converging dynamics are currently at work. We have already highlighted the importance of the long cycle of gold, generally estimated at 15 to 16 years. If this cycle is confirmed in the future, it is most often accompanied by a bullish phase of around twelve years. Nevertheless, the maturity of this bullish phase calls for caution and analysis.
The imbalance observed in the metals markets, particularly in silver, may legitimately fuel sustained speculation. The significant inelasticity of supply, combined with persistent tensions in the physical market, severely limits the market's ability to absorb speculative excesses. The coming weeks will therefore be decisive. They will allow us to assess whether there will be a rapid rebound in prices, a prolonged stabilization over several months, or, conversely, a continuation of the consolidation phase that began on Friday.
In the short term, a more pronounced correction in the equity markets could support a further decline in metals. On the other hand, a deeper crisis, particularly in the event of worsening global geopolitical tensions, would most likely reinforce the appeal of precious metals, reigniting a bidding war. In this context, JP Morgan has raised its most optimistic scenario to $8,000 per ounce in the long term.
From a technical perspective, the recent correction, although significant, did not cause a break in the major moving averages. Furthermore, the annual targets of several major banks were reached as early as January, which partly explains the current plateauing phase.
Despite high levels of volatility, the future performance of metals will depend primarily (from now on) on the trajectory of interest rates, the US dollar, and equity markets.
More By This Author:
Silver: The Dislocation Of Paper And Physical MarketsThe Collapse Of The Dollar Marks A Change In Monetary Regime
Should We Worry About A Gold Crash?
Disclosure: GoldBroker.com, all rights reserved.


