
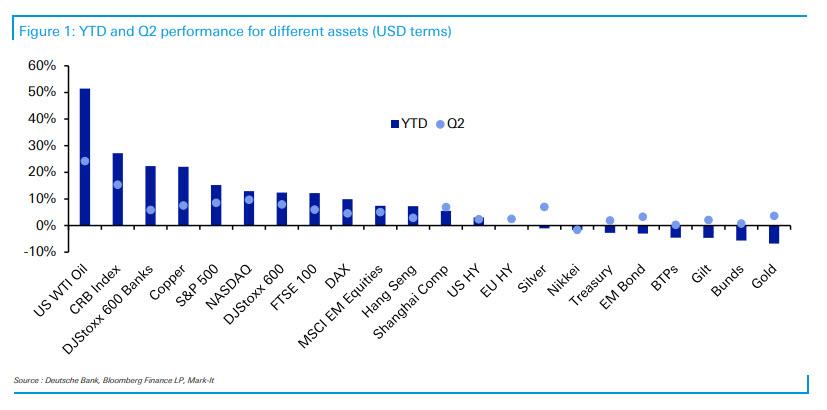
As we enter the second half of the year, a quick look at asset returns in the month of June, Q2, and the first half of the year as a whole shows that it has been a stellar performance across most financial markets, with 33 of the 38 non-currency assets tracked by Deutsche Bank moving higher over the last three months in local currency terms.
Having been left for dead in much of 2020, it should come as no surprise that the star performer in both H1 and Q2 was oil, with WTI up +51.4% and +24.2%, respectively. Even in June it was up +10.8%. On the other end, gold (-6.8% YTD) saw its worst month in June (-7.2%) since November 2016, with the Federal Reserve’s hawkish shift allaying concerns about inflation that had been very supportive for the precious metal.
Silver (-6.8%) lost ground too, but the losses weren’t just confined to precious metals, with the industrial metal of copper (-8.1%) experiencing its worst monthly decline since March 2020 when the initial pandemic selloff took place amid a Chinese crackdown on commodity prices. Though it was still up +7.5% in Q2 and +22.1% YTD, keeping it near the top of the pile.
Meanwhile, DB's Jim Reid notes that the reopening trade stumbled in Q2 and especially in June with the delta variant spreading. This is best highlighted in more micro numbers with the Euro Stoxx Travel & Leisure index -8.4% in Q2 on a total returns basis, bringing to an end a run of four successive quarterly gains as it recovered after the pandemic. Meanwhile in the US, the S&P 500 airlines index is down -11.4% over Q2 and -11.6% in June, similarly ending a run of four quarterly advances.
Despite the June swoon in reflation stocks, equities overall had another decent month which saw them cement their YTD gains, with the S&P 500 (+2.3%) and the STOXX 600 (+1.5%) both rising on a total returns basis in June, leaving their gains for the quarter at +8.5% and +6.8%, respectively.
To round things off, after climbing 82.7 bps in Q1, 10-year USTs rallied -27.2 bps in Q2. Where this goes in Q3 is probably one of the most important variables going forward, as it will tell us a lot about inflation, growth, delta, the Fed, and more generally about the funding glue that holds financial markets together.
Last but not least, and sadly not on the Deutsche Bank graph, Bitcoin (BITCOMP) continued to deflate as it fell for a third consecutive month with another -5.7% decline, and was down -41.3% in Q2, meaning it is now ‘only’ +19.3% YTD after having been +123.7% at its intraday peak on April 14.
In terms of other currencies, the main story for June was the dollar’s +2.9% gain after the Fed meeting saw the median dot bring forward the first hike into 2023, which (in the reverse image of gold) is the currency’s best month since November 2016.
However, for the quarter as a whole, the dollar remains -0.9% lower. EM currencies also saw some pretty sizable moves, with the Brazilian real strengthening +13.4% over Q2 against the US dollar, whereas the Turkish Lira fell another -2.5% in June as part of its fifth consecutive monthly decline.
The sovereign bonds in the DB sample all remained in negative territory on a YTD basis, though Q2 saw a more divergent performance as Treasuries (+1.9%) and gilts (+1.8%) recovered, whereas their European counterparts, including bunds (-0.4%) and BTPs (-0.8%), lost ground. HY has continued to outperform on a YTD basis.
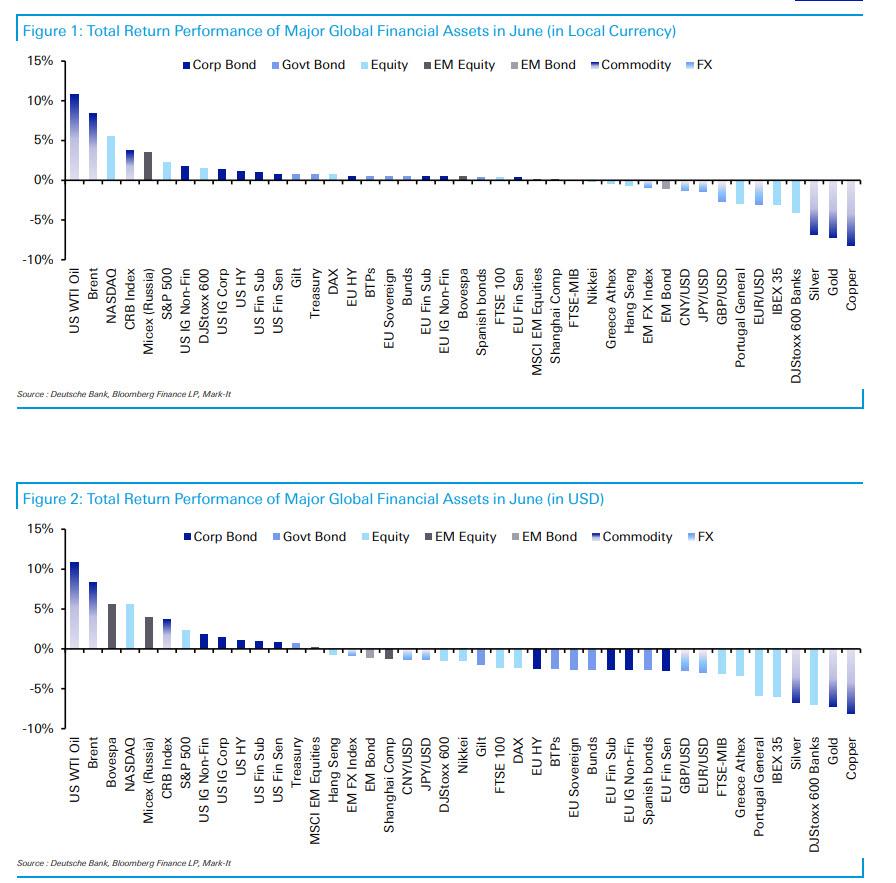
And here is the performance charted for the month of June in local currency and in US dollars.
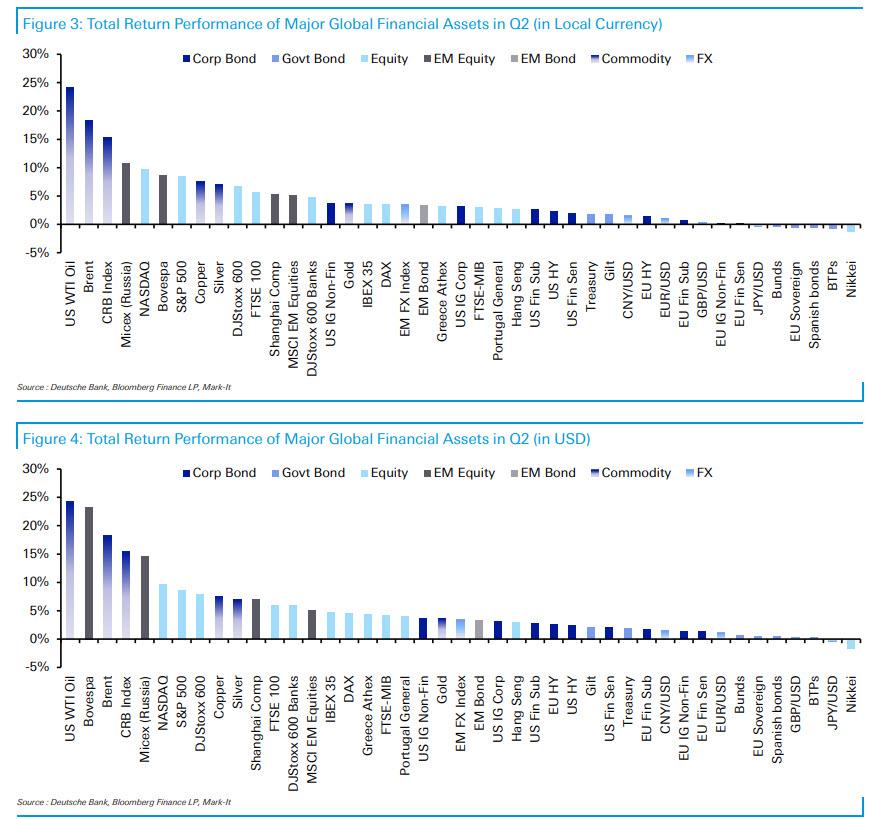
Q2:
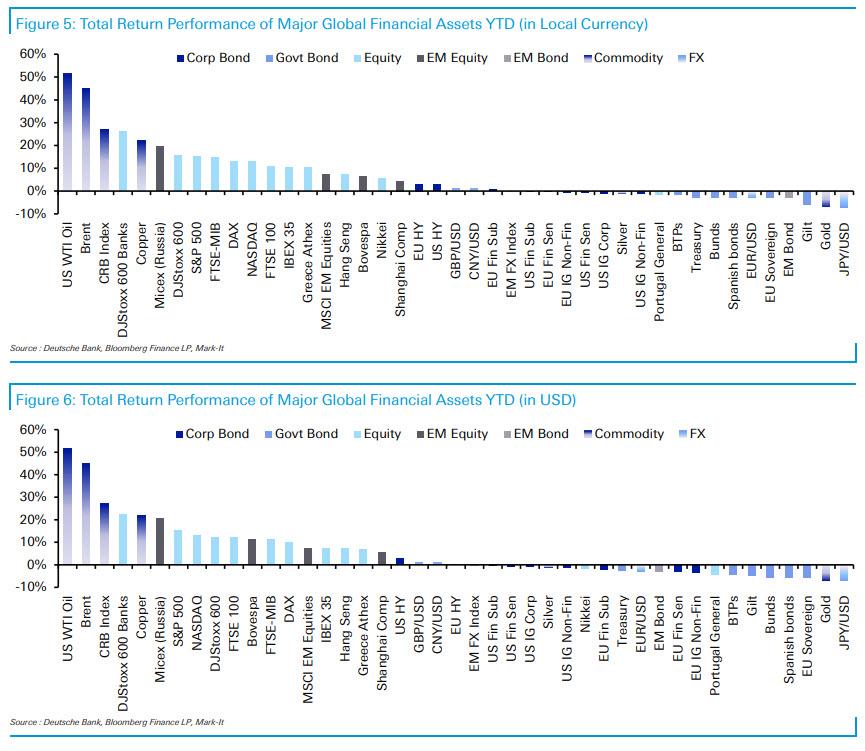
Year-to-date:


Comments
Log in or sign up to join the conversation.