
Is it worth watching USDX performance?
You already know the key thing about the current market situation, as I explained it yesterday – we saw key weekly (!) reversals across the precious metals market as well as in one of the key gold price’s drivers – the USD Index.
In today’s analysis, I will dig deeper into the latter, as understanding what’s happening to the USD Index provides critical context for moves that we see in the precious metals market. In fact, that’s one of the best ways to check if a given price move “has legs” or if it’s just price noise without much meaning.
Also, as a reminder, the other of the two key drivers for the price of gold are changes in real interest rates, and I discussed that in greater detail on Thursday.
As you may recall from my yesterday’s analysis, the USD Index formed a bullish weekly “hammer” reversal candlestick. As I wrote, it was likely to be followed by a sizable rally, and that’s exactly what we saw. The USDX soared by another 0.74 yesterday, which means that it has rallied by 1.58 so far this month. That’s less than it had declined in January, which means that 2023 is now an “up year” for the USD Index.
This is exciting on its own, but wait until you see the context!
Well, you didn’t have to wait for long, as here it is:

The early 2023 decline was a move below one of the key Fibonacci retracement levels – the 50% level. At first glance, this appeared to be a bearish development. However, fortunately, that’s not the only sight that we give. The move was small enough and accompanied by specific narratives that made us doubt whether the breakdown below this level would be confirmed.
And it wasn’t! We saw invalidation instead, and it happened in the most bullish way imaginable – in the form of a (powerful) weekly reversal.
Before I tell you about another super-bullish thing that just happened in the USD Index, I’d like to explain why the Fibonacci retracement levels are important at all – as a courtesy to those who are new to trading. Or maybe you simply used those levels but always wondered what’s up with them, and why they work so often.
To make a long story short, the Fibonacci sequence, ratio, and thus retracements are things that appear in nature in many places. People are a component of nature. People create markets. So, why wouldn’t it be the case that some things that people do, i.e., in the markets, work according to the Fibonacci rules?
For example, one price move is like the other (previous but related) price move but multiplied by 1.618? Or multiplied by it twice? 1.618 x 1.618 = ~2.618. Or inversed? 1 / 1.618 = ~0.618.
In the case of price movements, we must identify the key points of any price movement—its beginning and end.. And we can apply the above-mentioned multiplications to both: start and end of the move. When we apply the retracement from the opposite side, we get 1 - 0.618 = 0.382. Half of a given move doesn’t result from the Fibonacci sequence itself, but multiplication by two and division by it are also common in nature.
That’s pretty much it. The “retracement levels” that you see on the above chart (marked with black) represent those above-mentioned levels based on the most recent important rally, and they are shown in percentage terms (so, 61.8% instead of 0.618).
All right, having said that, let’s check what’s so bullish about what happened yesterday and why so many investors missed it.
- Hint #1: The horizontal, thick, red line represents what just happened.
- Hint #2: Investors (and, sadly, many analysts) often focus only on what happened this week, last month, or maybe in the past year or so, and they miss the very valuable analogies and links to a more distant past, incorrectly assuming that “it doesn’t matter.” It does matter, as the psychological mechanisms that caused investors to panic or get greedy at certain price levels remain unchanged.
The critical thing that happened is that the USD Index moved back above its 2016 high! The breakdown below was just invalidated!
Yesterday’s closing price was 103.5, and at the moment of writing these words, the USD Index is trading at 103.66.
Now, let’s see where the USD Index traded back in 2016 and in 2020.
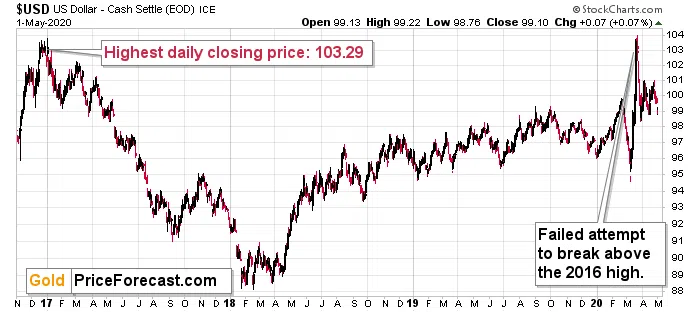
The highest daily close of 2016 was 103.29. This means that yesterday’s closing price was higher, and thus the breakdown was invalidated. Or, one might say, that the support provided by this high actually held, despite the small (from the long-term point of view) move below it.
Either way, the implications are profoundly bullish.
Not only did the USD Index just form a weekly reversal and move back above its 50% Fibonacci retracement, but it even moved back above its 2016 high! This is a very bullish combination of indications.
Since the precious metals sector tends to move in the opposite direction from what’s happening in the USD Index, this is a very bearish combination for gold, silver, and mining stocks.
- Wait a minute, what about the 2020 high?
This high – in terms of the daily closing prices – was exactly 103.5, which means that it was just matched. However, this high is not nearly as important as the 2016 one, because the 2020 rally and subsequent top were the USD Index’s attempts to break above the 2016 high. This attempt failed, so the 2020 high is not as important as the 2016 high.
Also, do you remember about the supposedly bearish “death cross” in the USD Index that so many investors (and analysts!) got worried about? And the one that I talked about in my Jan. 11 video, where I explained why it doesn’t work as a bearish signal for the USD Index and that it’s actually a bearish signal for gold?
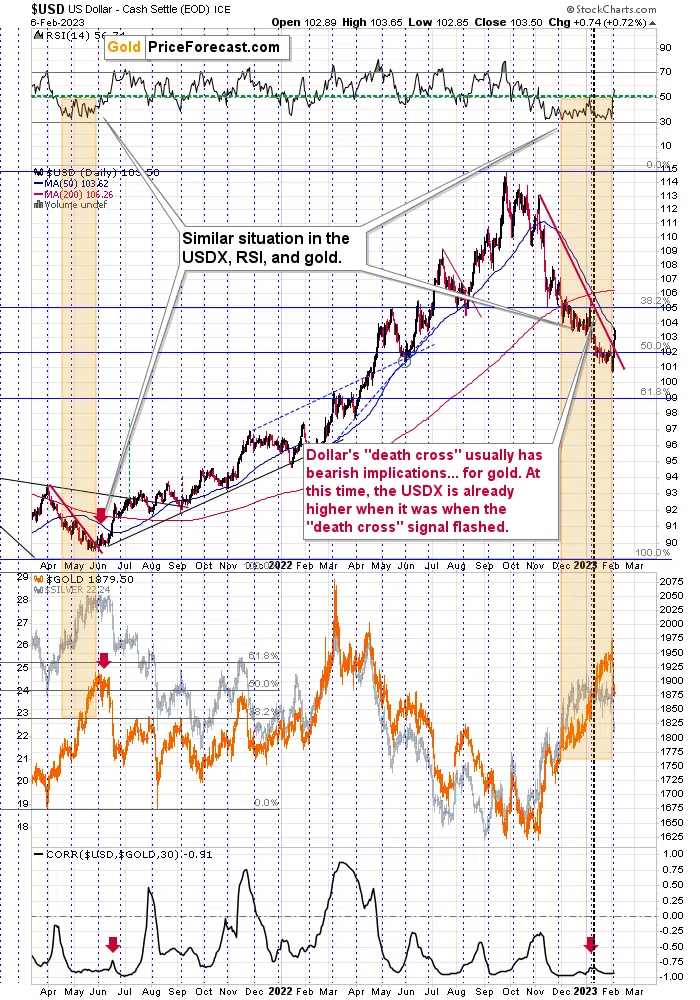
Well, the USD Index is already above the price levels at which it was trading when the “death cross” signal flashed, likely leaving many inexperienced investors scratching their heads. - “Wasn’t a death cross supposed to bring, you know, death, destruction, or at least declines?”
No. It doesn’t matter how fancy a name a given trading tool or technique has. Before applying it, one should always check if it works in a given market. If it doesn’t, then don’t use it – simple as that. The reliability of the “death cross” signal was next to none for the USDX, and indeed, it moved just a little lower and then it moved back up.
Based on multiple indications that I commented on in today’s analysis, the USD Index rally is likely to continue, continuing to baffle those who bought the “death cross” narrative at face value without checking if it really works.
What actually happened in most cases after we saw the USDX’s “death cross” was that the gold price then declined profoundly, either shortly or soon enough. And, well, that’s exactly what we saw recently.
To summarize, in my view, the real interest rates are up and about to soar higher, the USD Index most likely bottomed and is likely to soar, while the precious metals topped in a spectacular manner and are now likely to slide – either shortly or soon enough. The rally in gold, silver, and miners was indeed sizable, but… It’s over.
What’s next? Something exciting (and, in my view, lucrative) or something scary – depending on how positioned and informed one chooses to be.
Also, please note that (paraphrasing Sun Tzu) “understanding the enemy without understanding your true self is only half of a victory.” Before applying any insights into actionable practice (and placing or adding to your trades), please make sure that the position that you’re about to enter and its size are aligned with your approach, your investment goals, and your risk tolerance.
In other words, I suggest starting with yourself and tailoring the trade to you, not the other way around. This will save you lots of stress, which is not only end in and of itself (your happiness and health are both closely linked to your stress levels), but it also helps you become a more profitable investor as less stress (or none thereof) means more objectivity and less risk of “running for the hills” right before a given trade becomes profitable (perhaps extremely so).
More By This Author:
The Price Of Gold Is Still Near Its 2011 High
What's Happening Across The Markets?
Another Day, Another Attempt In Gold; Is Another Failure Next?


Comments
Log in or sign up to join the conversation.