

Image Source: Unsplash
Gold was trading flat on the week by Tuesday after it had extended last week’s drop on Monday. While not out of the woods, gold may be able to regain its poise and resume higher after last week’s drop when gold hit a record high before taking a drop to close lower. Its failure to hold above the previous record highs of April ($2431) and May ($2450) has raised some concern that gold may have hit a peak. However, I am doubtful that is the case and expect the precious metal to bounce back, potentially reaching a new record soon. After all, this is not the first time we have seen such bearish price action before the bulls have roared back.
Weekly Chart Analysis: Is This Another Bear Trap for Gold?
(Click on image to enlarge)
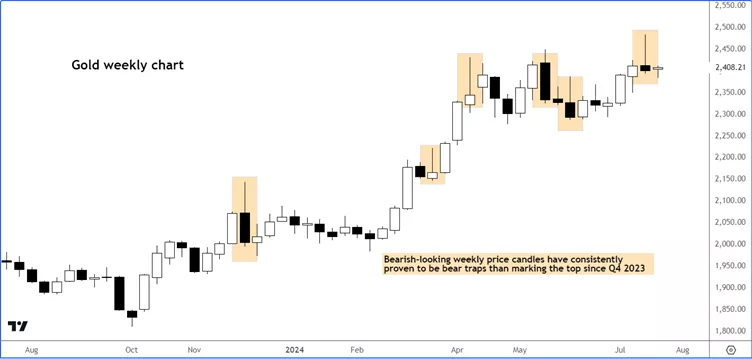
Last week’s drop resulted in a bearish-looking inverted hammer candle on the weekly gold chart. This pattern, combined with its failure to maintain levels above the previous record highs, has sparked fears that gold might have hit its peak. However, as highlighted in the chart, gold has exhibited similar bearish weekly price actions several times since Q4 2023. In most cases, there has been only modest downside follow-through, with some candles completely engulfed by the next week's price action, indicating no real control by the bears. Last week's inverted hammer candle, although seemingly bearish, could turn out to be yet another bear trap.
Key Levels to Watch for Gold
On the daily timeframe, gold has reached potential support between $2385 and $2400, where prior resistance meets the 21-day exponential moving average (EMA).
(Click on image to enlarge)
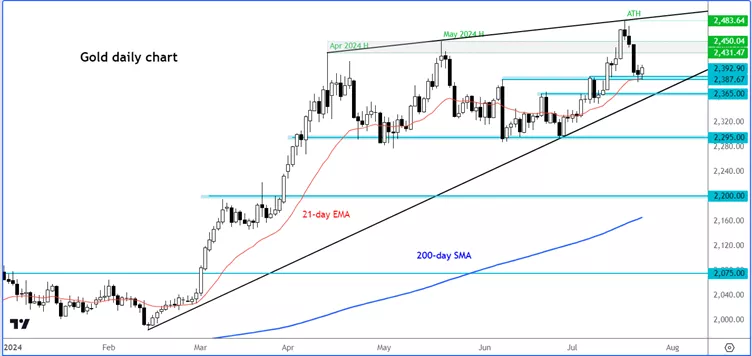
The 21-day EMA typically offers strong support in trending markets. If this support holds, the bullish trend may continue. However, if it breaks, the next significant support level is around $2365, where the bullish trend line since February comes into play.
In terms of potential resistance, the $2450 level is crucial as gold peaked there in May and failed to hold above it last week. Above this, last week's all-time high of $2483 and the psychologically important $2500 level are key targets for the bulls if the bullish trend resumes.
Key Economic Events to Watch This Week: PMIs, GDP, and Core PCE
This week is packed with market-moving data that could influence the dollar and gold prices. Here are the key events on the economic data calendar to watch:
Global PMIs - Wednesday
The European manufacturing sector has been struggling over the past two years, with PMIs reflecting minimal growth. Any signs of improvement will be welcomed by the markets. Additionally, the services sector PMIs, especially the prices component, will be crucial as they can be a leading indicator of inflation. Persistent inflation in the services sector has made central banks hesitant to cut rates. If the data boosts market confidence in potential rate cuts by the ECB, BoE, and Fed, it could support gold and silver prices.
Advance US GDP - Thursday
Thursday brings the advance estimate of second-quarter GDP growth and the June core personal consumption expenditure (PCE) deflator, crucial for the dollar and gold. The first quarter saw modest growth of 1.4%, with consumer spending at 1.5%. Analysts expect stronger results this time, projecting growth around 1.9%, driven by improved consumer spending, rising inventories, and stronger investments. If the economy grows closer to the expected 2%, the second half of 2024 may present challenges, potentially prompting the Federal Reserve to consider rate cuts starting in September anyway.
Core PCE - Friday
Comments from Federal Reserve officials, a cooling jobs market, and declining CPI suggest the central bank is nearing a rate cut, potentially as soon as September. The core PCE price index, their preferred inflation measure, will be crucial on Friday. Encouraging data could bolster their confidence, but if the numbers disappoint, uncertainty will persist. For gold, signs of persistent inflation are not necessarily bad, as investors often turn to gold to hedge against rising prices. If inflation is weaker than expected, gold may benefit from a corresponding drop in the US dollar. Thus, inflation data is unlikely to threaten gold's bullish trend.
In short
Gold's recent drop may appear concerning, but historical patterns suggest it could be another bear trap. Key support levels and upcoming economic data will be critical in determining the precious metal's next move. Investors should keep a close eye on this week's events to gauge the potential impact on gold prices.
More By This Author:
EUR/USD Extends Gains Ahead Of ECB Rate DecisionGold: Record Highs On The Horizon
GBP/USD: Focus Turns To US CPI As Traders Eye $1.30 Handle


Comments
Log in or sign up to join the conversation.