
Gold has recently demonstrated a highly bullish long-term outlook. The breakout at the critical $2,075 level, marked by an inverted head and shoulders formation, has indicated a robust surge in gold prices. This breach is further supported by an ascending broadening wedge pattern, suggesting that gold prices are poised to reach higher targets, potentially up to $3000. The combination of these technical indicators highlights a potent bullish momentum, pointing towards a significant upward trajectory for gold. This article presents the strength of the bullish trend, driven by these reliable technical patterns, and suggests sustained elevated prices and potential substantial gains soon. The article also discusses the strategies of how to trade gold during times of economic uncertainty.
Gold Major Breakout from Key Level
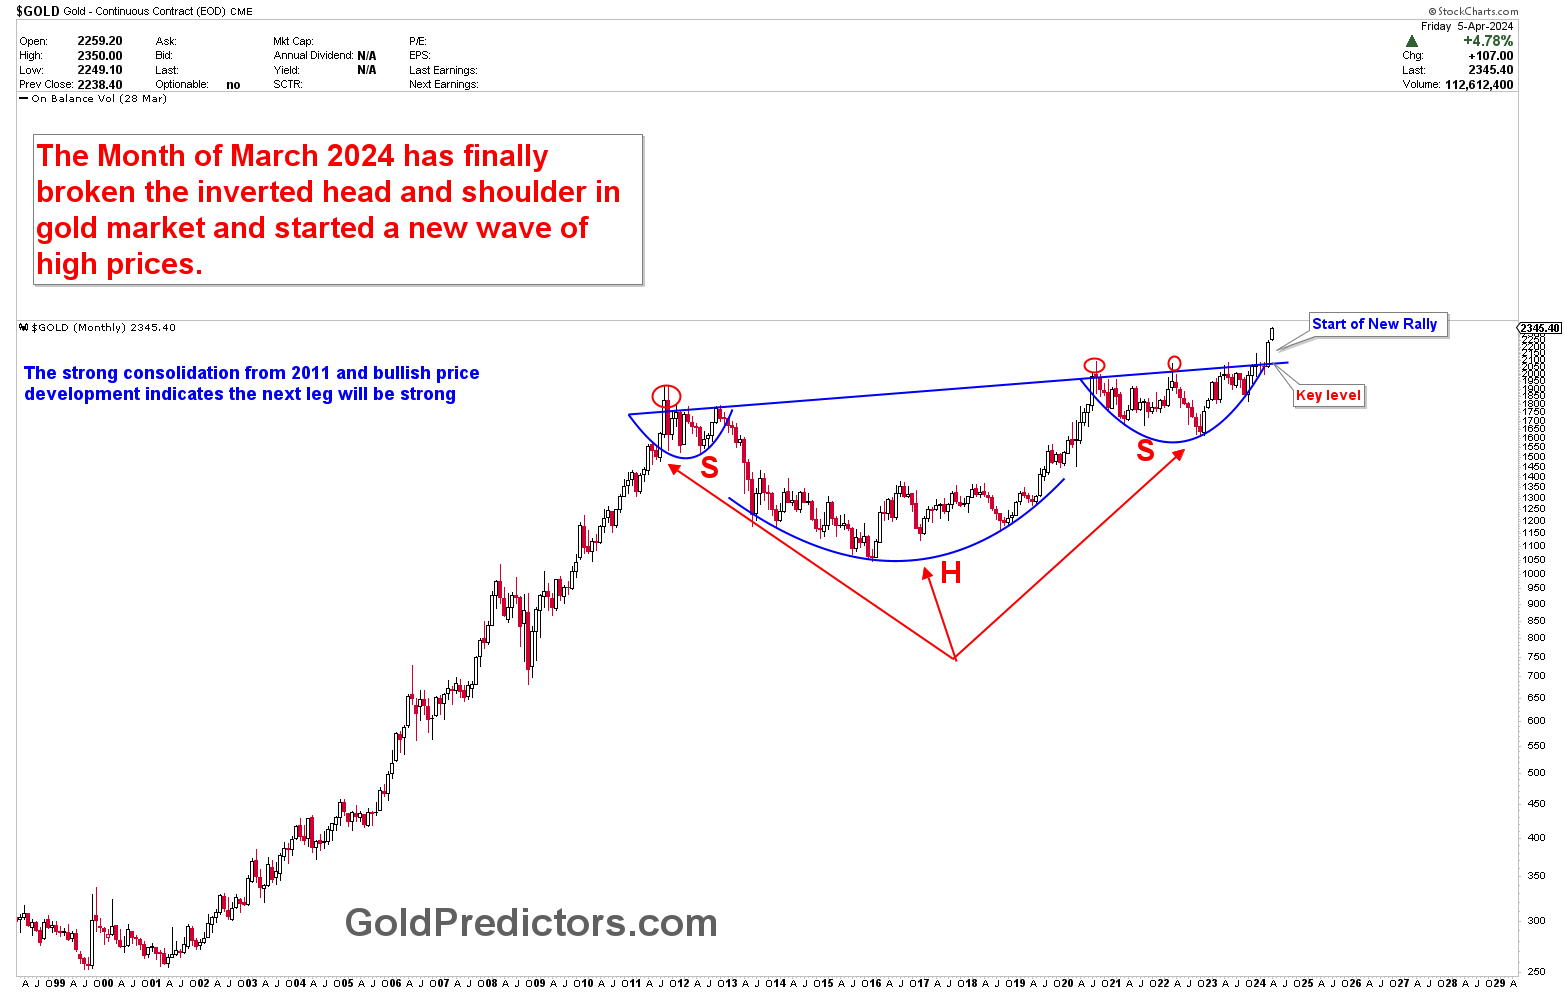
The chart below presents a strongly bullish long-term outlook for gold, highlighted by an inverted head and shoulders pattern. This pattern was breached at the $2075 level, indicating a robust surge in market prices. The breakout at this level suggests that gold prices are likely to remain elevated and could achieve higher upside targets.
Another chart further supports this bullish scenario, showing a breakout from the long-term pivotal area of $2,075, which has initiated a strong surge toward the $3,000 mark. This target is derived from an ascending broadening wedge pattern, a bullish technical formation that may induce significant upward price movements. These bullish price configurations include inverted head and shoulders within the ascending broadening wedge pattern.
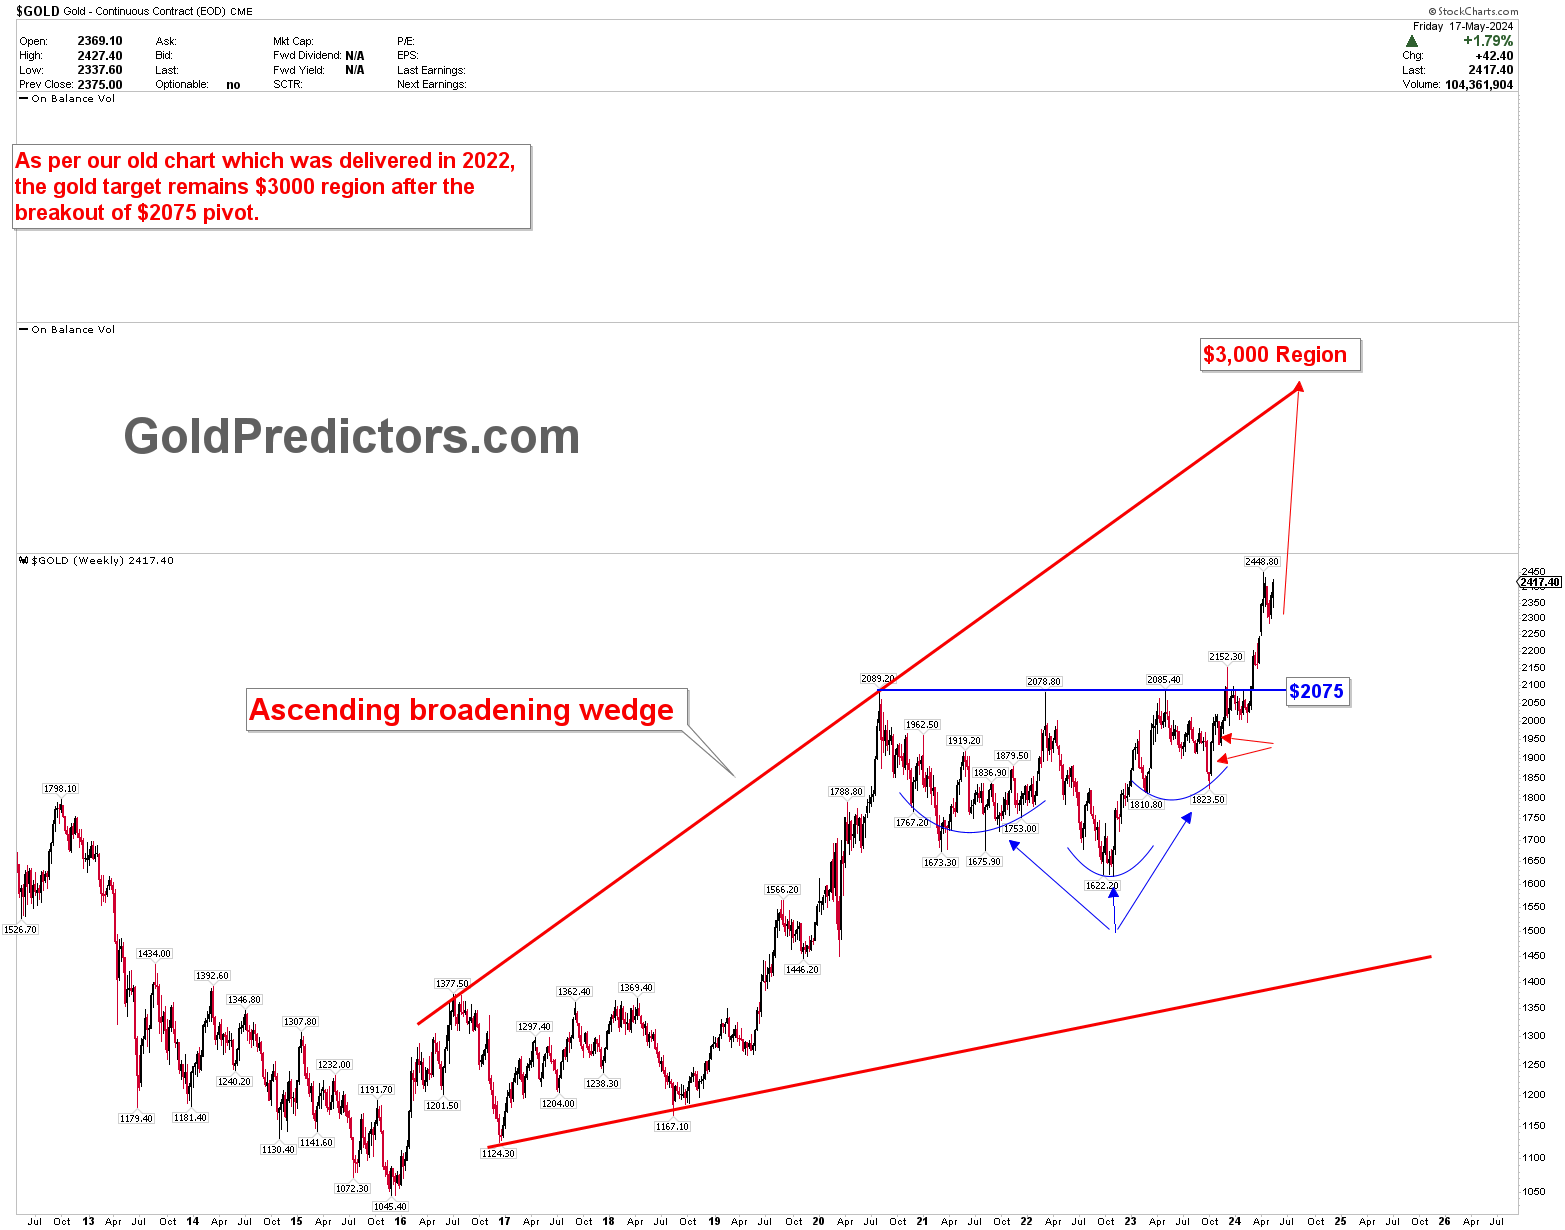
The breakout from the $2,075 level confirms the ascending broadening wedge pattern breaks the inverted head and shoulders formation which shows a strong bullish trend. This combination of technical indicators underscores a potent bullish momentum, suggesting that gold prices could potentially rise to $3,000. The inverted head and shoulders pattern, a reliable indicator of trend reversals, combined with the ascending broadening wedge, which signals expanding volatility and potential for substantial price gains, point towards a significant upward trajectory for gold.
How to Trade Gold During Uncertainty
Trading gold during periods of high volatility, especially driven by geopolitical uncertainty, requires a strategic approach. The market is heavily influenced by events, meaning any impactful occurrence can abruptly change its direction. Investors must be cautious and strategic, entering the market when gold has completed its correction.
For instance, Gold Predictors identified a buy trade at the $1996 level, which was communicated to premium members via WhatsApp and email. The market hit a low the very next day and then surged significantly. At that time, market sentiment expected a downside move, but geopolitical uncertainty propelled prices higher. Another successful entry occurred at the $2155 level. Gold reached a low at this point and then rose sharply to record highs. Following this strong rally, gold prices corrected lower, and Gold Predictors identified another entry point at $2286.50, again communicated to premium members. Post-entry, gold prices surged sharply, reaching new record highs.
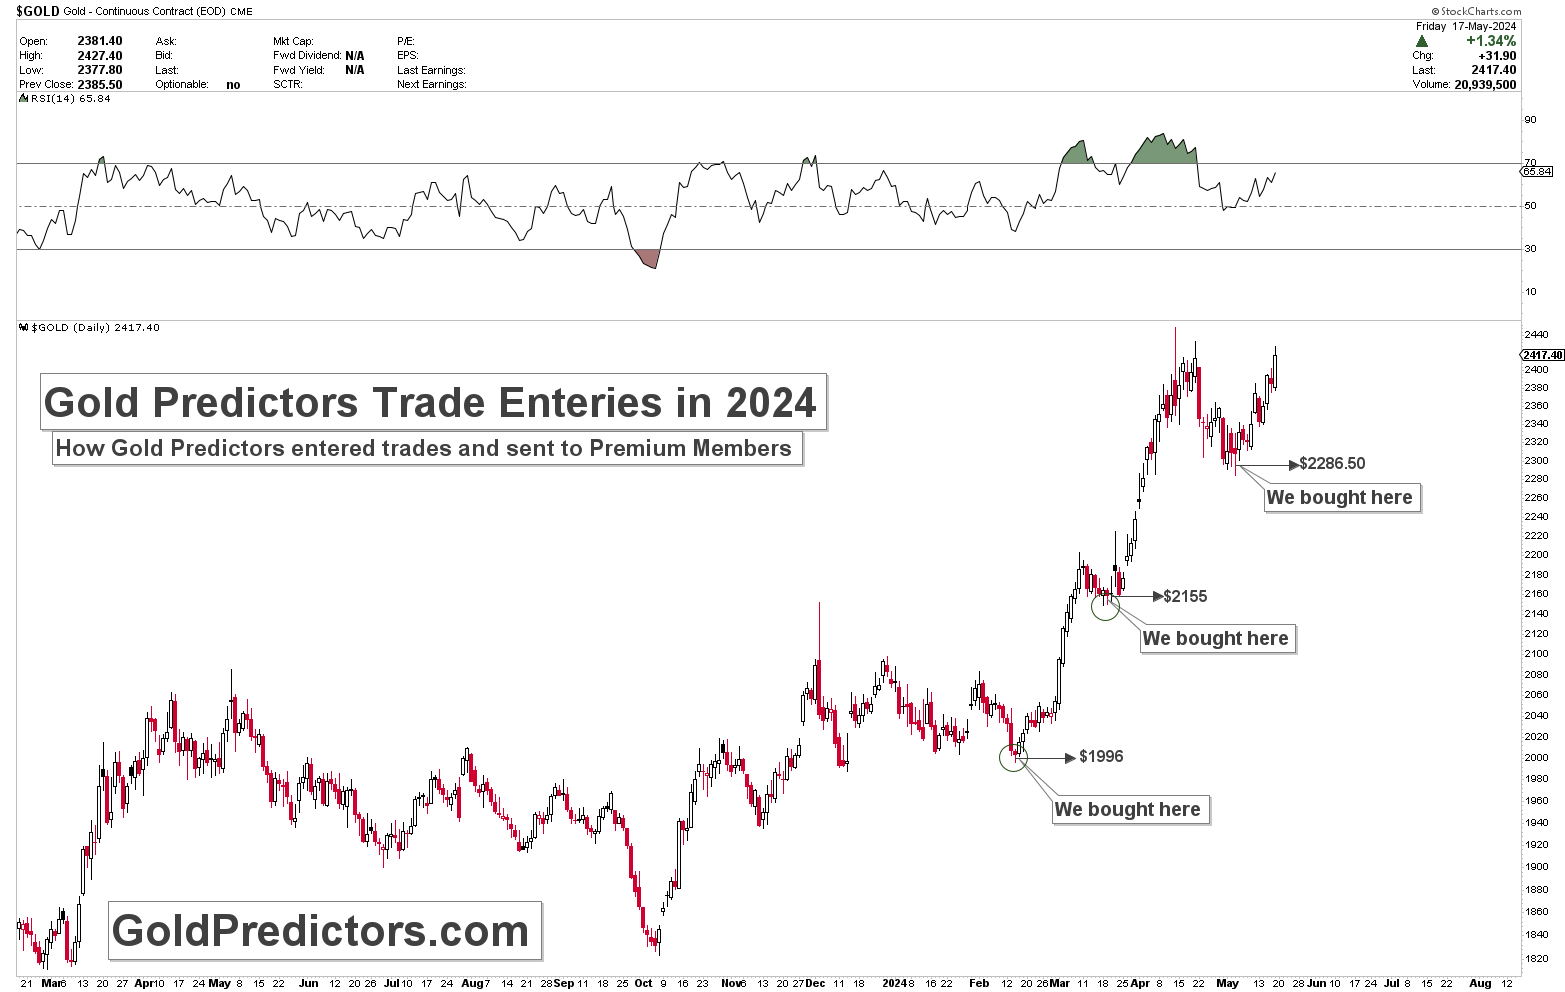
These trade examples highlight the importance of entering the market after a correction during times of economic and geopolitical instability. Each of these trades shared a common pattern: the market was attempting to bottom out at these levels before moving higher. This strategy of entering post-correction allows investors to capitalize on the subsequent price surges driven by volatility and uncertainty.
Therefore, during periods of economic and geopolitical uncertainty, investors and traders must enter the market once a correction has occurred and the market shows signs of preparing for the next upward move. The trades shared with premium members by Gold Predictors demonstrate this approach effectively. By timing entries post-correction, investors can better navigate the volatile market conditions and maximize their returns during uncertain times.
Conclusion
In conclusion, the breakout at the critical $2,075 level, highlighted by an inverted head and shoulders formation, indicates a robust surge in gold prices, further supported by an ascending broadening wedge pattern. These indicators suggest that gold prices are poised to reach higher targets, potentially up to $3,000, underscoring a potent bullish momentum. Moreover, investors and traders may enter the market when prices are at lower levels as the increased volatility results in wide price ranges.
More By This Author:
Marvel Technologies Emerges Bullish Patterns
Gold Emerges Strong Buy Despite Short Term Challenges
Gold’s Persistent Bullish Phases Mark A Century Of Growth


Comments
Log in or sign up to join the conversation.