
Gold Trading In A Complex Correction
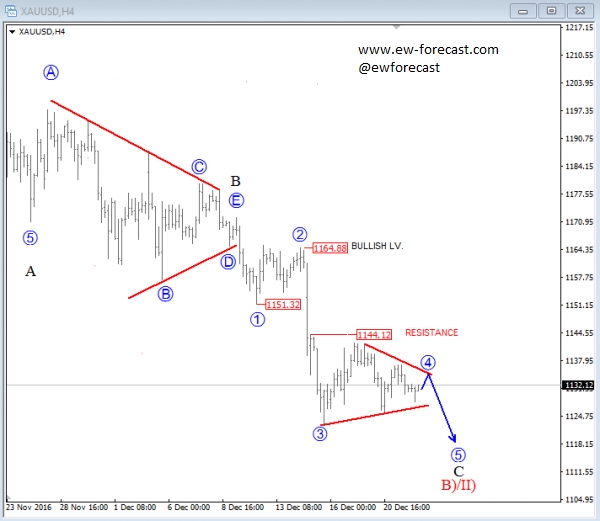
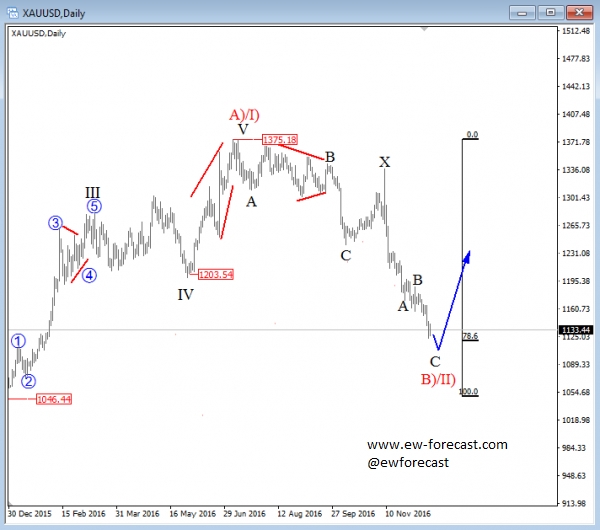
Gold is moving sharply lower, away from 1337 swing high, where the market found a top of wave X that belongs to a big complex decline as shown on a daily chart (below). So we are tracking a double zigzag which should now see more weakness as sub-wave B is considered a completed triangle on the 4h chart. As we see more weakness is now in play for wave C of B)/II) as the price made a nice drop towards the 1122 level labeled as sub-wave 3-circled after a top had been found for the previous corrective wave 2.
Now we see the market making in an overlapping and slow display of price activity in the corrective wave 4-circled, that could in sessions ahead prove to be an Elliott Wave triangle correction. That said, more weakness is expected to follow into wave 5 of C after this correction takes place.
GOLD, 4H
GOLD, Daily
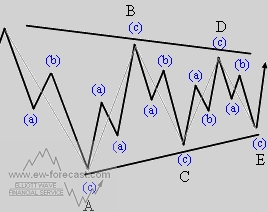
Triangles are overlapping five wave affairs that subdivide 3-3-3-3-3. They appear to reflect a balance of forces, causing a sideways movement that is usually associated with decreasing volume and volatility.
Basic Triangle Pattern:
Disclosure: None.


Thanks for sharing