
Gold: The Reaction Has Arrived Exactly At The Right Time
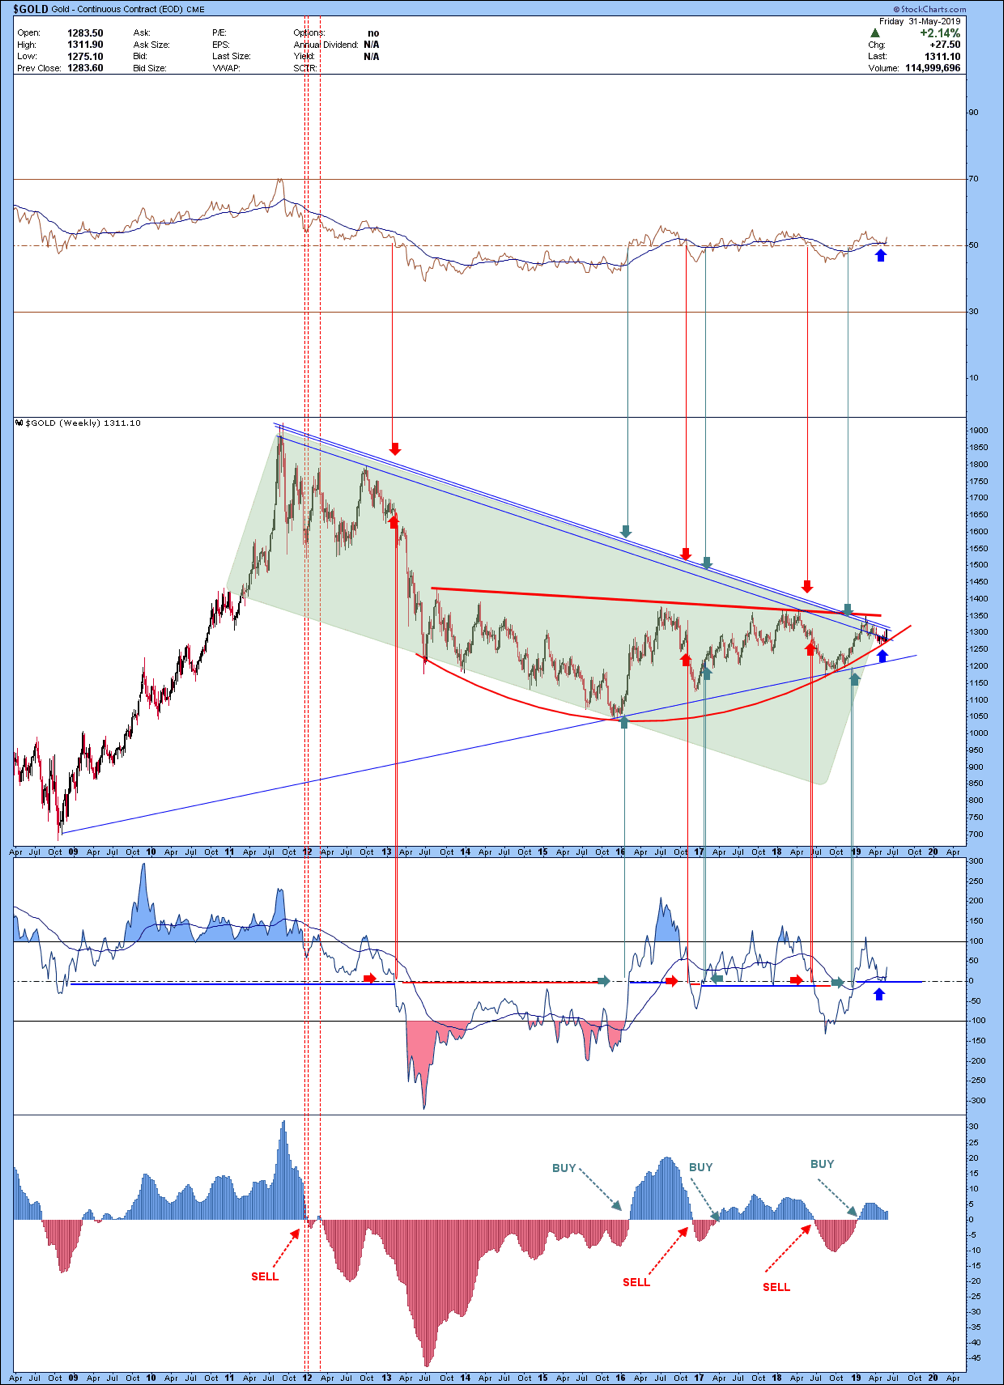
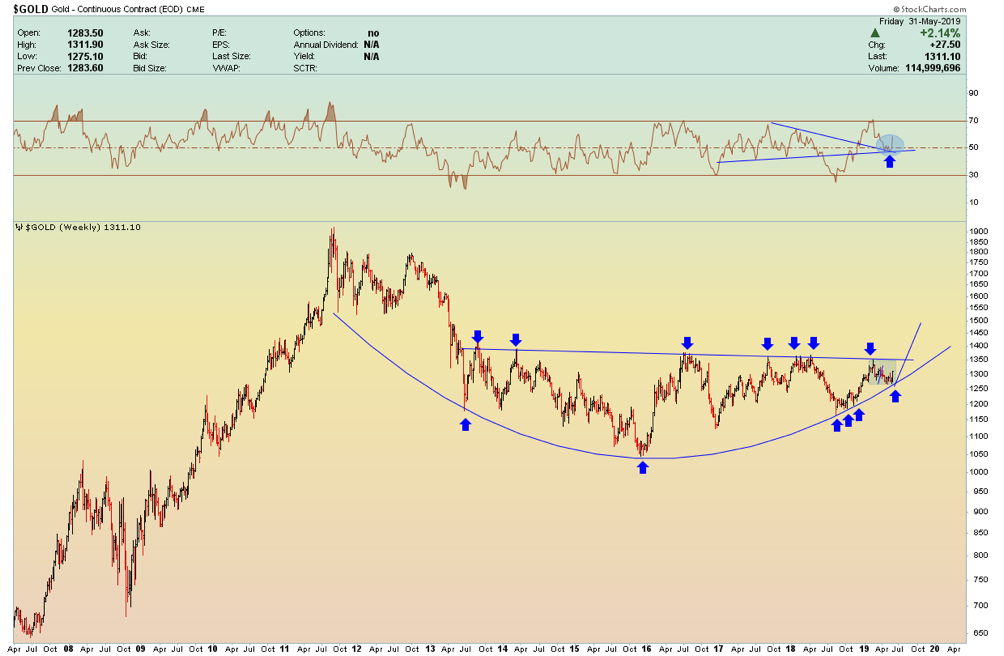
On March 17th, I published the long-term graph of gold in which I pointed out that the structure was bullish and no bearish signs were seen. After about two months of consolidation, gold has touched the red evolvent from which it immediately rebounded: this confirms not only that the structure is perfectly aligned to a bullish view, but that the red evolvent represents exactly the support to be monitored. Another important note is represented by the fact that all the indicators have maintained the bullish setting remaining above the support levels and this further strengthens the bullish view. Now we need to wait for both the bearish trendline and the $1350-$1360 level to break, which will mark the real strong mid-term upward signal.
TECHNICAL SIGNALS ON THE WEEKLY CHART CONFIRM BULLISH EXPECTATIONS
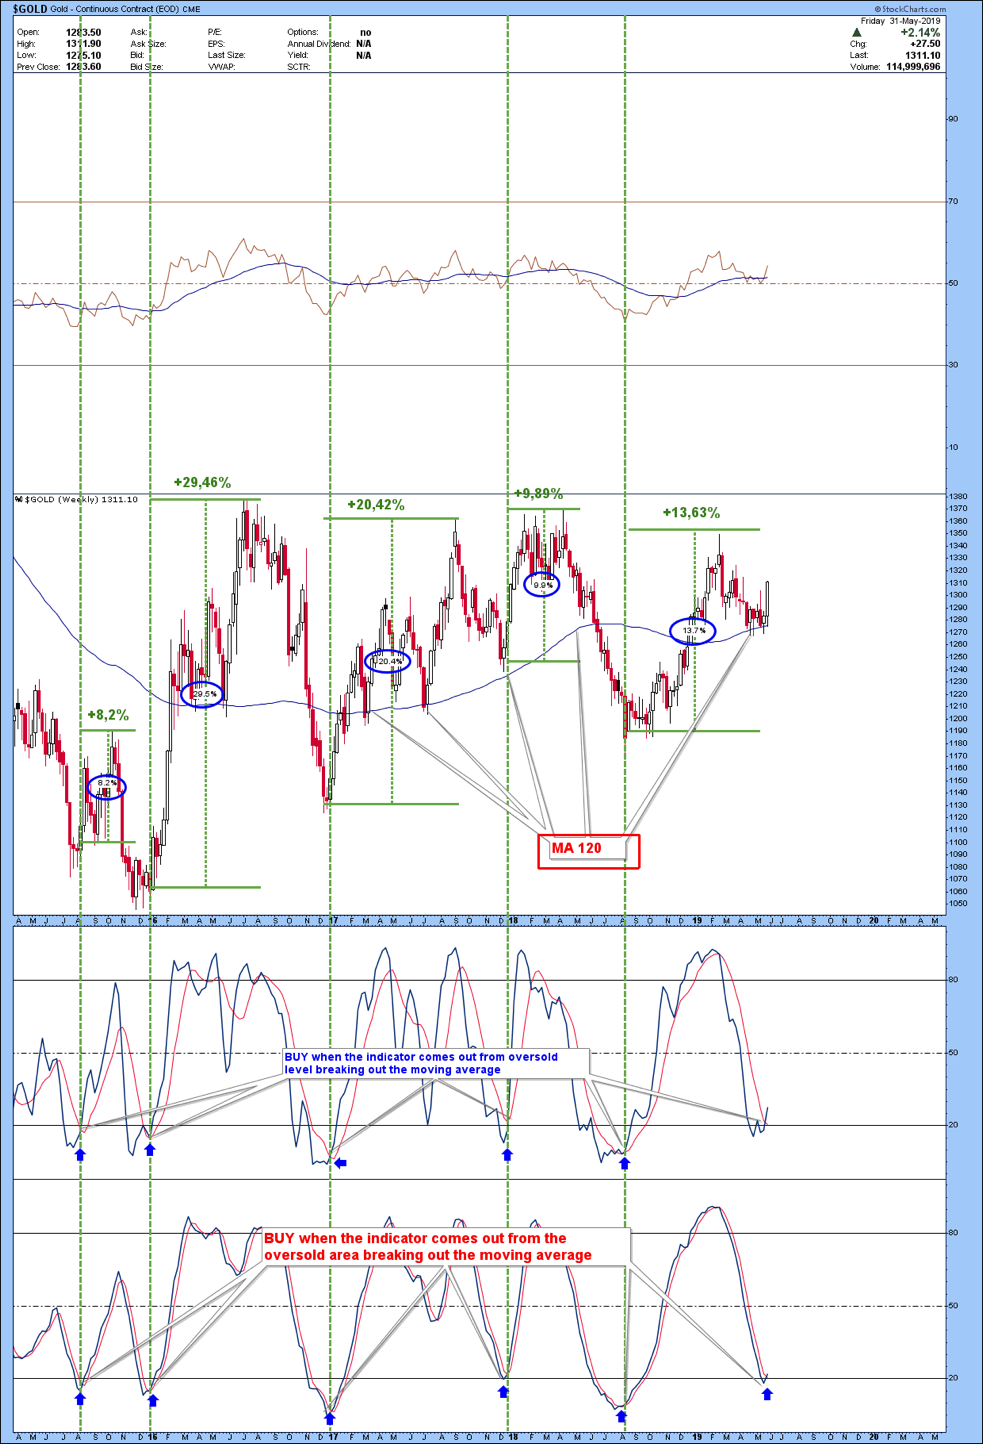
There are technical evidences on the weekly charts that would indicate that the past week has triggered a medium-term bullish signal while the long-term moving average has been perfectly tested in this corrective phase and the two indicators have reversed the trend from the oversold zone. Since 2015, this type of signal has been triggered 5 times and every time we have seen an important rise. The average increase was +16.4% within 4 to 8 months. Also, in this case, it is clear that the level of $1350-$1360 will represent the main resistance beyond which broadly bullish scenarios will open in the coming months.
Disclosure: GoldBroker.com, all rights reserved.


