
Gold Technical Outlook: Gold Prices Snap Back Ahead Of Q4 Open
It’s been another strong quarter for Gold prices and with two trading days left before the end of Q3, a pullback has shown up. While this may be attributed more to end-of-month and end-of-quarter flows, Gold prices are still showing overbought readings via RSI on the weekly chart and as discussed in these Gold technical pieces in the recent past, a deeper pullback can make the prospect of longer-term bullish trends as more attractive. The big question now – how deep will that pullback go and when might bulls be ready to jump back in?
At this point, Gold prices are holding above the 1500 level of psychological support while showing a bit of short-term resistance from a familiar Fibonacci level at 1509.64. This is the 61.8% retracement of the 2012-2015 sell-off in Gold and has most recently come-in as near-term resistance a week ago.
GOLD FOUR-HOUR PRICE CHART
(Click on image to enlarge)
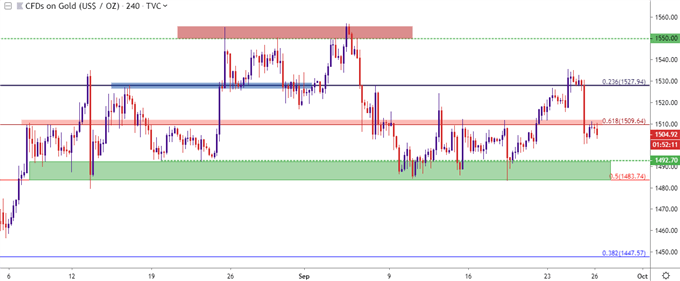
Chart prepared by James Stanley; Gold on Tradingview
GOLD: HOW DEEP CAN SELLERS PUSH?
For all intents and purposes, the bulk of this quarter’s bullish move showed up in early-August, just after the FOMC rate cut and as tensions with China were continuing to rise. That pushed Gold prices all the way above the 1550 level, which was tested thrice, each of which failed. Since then, prices have returned for multiple iterations of support in the area that runs from 1483.74-1493. This highlights the fact that more than half of Q3 has seen range-bound behavior in Gold prices, even with the strong bullish bias as brought upon by the fundamental and monetary backdrop. The big question here is whether this end-of-the-quarter pullback can test through that longer-term zone of support that’s built-in over the past seven weeks? At this point, that support can remain attractive for bullish strategies.
GOLD EIGHT-HOUR PRICE CHART
(Click on image to enlarge)
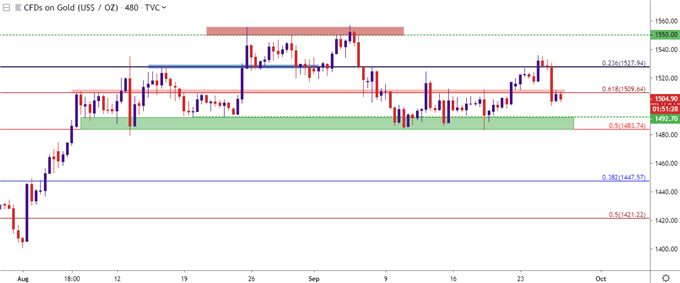
Chart prepared by James Stanley; Gold on Tradingview
GOLD PRICES BEARISH STRATEGIES
Given the proclivity towards bullish themes in Gold, combined with the backdrop that’s produced them, traders still may want to move forward with a longer-term bullish bias on the matter.
However, given the short-term resistance combined with the longer-term overbought nature, added to the end-of-quarter backdrop, and there could be scope for short-term bearish scenarios, looking for prices to drop from the current area of Fibonacci resistance down for a test of longer-term support in the zone investigated above. Traders would likely want to couple that approach with relatively tight stops in the event that another bullish flare does develop so that losses could be mitigated as the grander trend takes over.
GOLD TWO-HOUR PRICE CHART
(Click on image to enlarge)
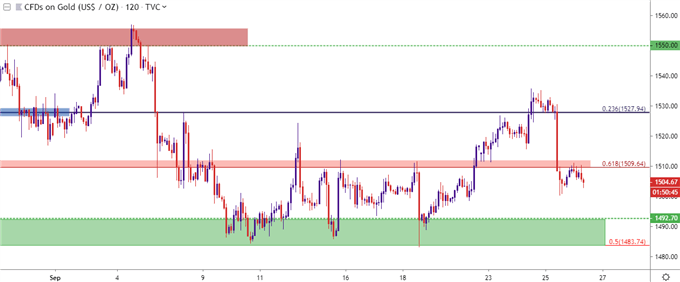
Chart prepared by James Stanley; Gold on Tradingview
GOLD BIGGER PICTURE STRATEGY
At this point, the fear of a hawkish Fed doesn’t really appear to be much of an issue. The big question around the FOMC for Q4 is if they cut rates again or whether they punt that decision into Q1/Q2 of 2020. This can keep motive for bullish biases for longer-term approaches, and as discussed in these pieces in the very recent past, there are a number of potential support levels of a longer-term nature that could be of interest should they come into play. And the fact that a pullback is showing ahead of quarter-end may be that scenario that brings that opportunity.
Looked at above is a very obvious zone of support that’s been in-play over the past couple of months, but a bit deeper brings another couple of levels that remain of interest. Specifically, areas around 1475 and 1450 provided some element of resistance when prices were on the way up but, as yet, haven’t shown much for support since the bullish trend sliced through each price in early-August trade.
The 1475 level, while nearby, would offer the luxury of taking out trailed stops that are likely sitting just below the current zone of support. The 1450 area, on the other hand, is very near another Fibonacci level of relevance at 1447.57, which could help to build a zone of potential support to look to for a bigger-picture pullback scenario.
GOLD EIGHT-HOUR PRICE CHART
(Click on image to enlarge)
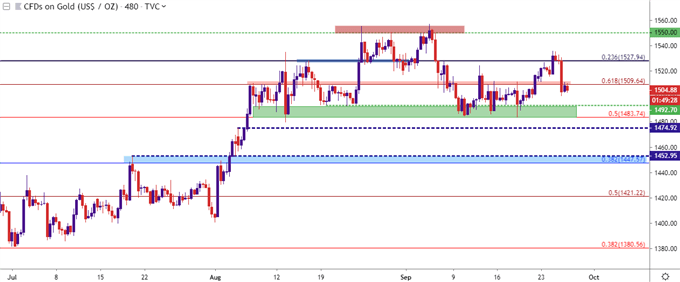
Chart prepared by James Stanley; Gold on Tradingview


