
Gold Technical Analysis: What’s Next For Precious Metal?

Image Source: Pexels
After a weaker start, gold prices started to push higher during Asian hours and completely wiped out losses from Friday. Today’s rebound may have been driven by mild haven flows amid uncertainty about the Ukraine war, something which also held back stocks first thing. But crude oil prices fell as Zelenskiy and his European allies arrived in Washington to find out what Trump committed to at his meeting with Putin.
The precious metal fell 1.8% last week, and thus ended a two-week winning run. Still, it remained inside the prior ranges, with no clear directional bias in so far as the short-term outlook is concerned. In fact, in the last three months, gold prices have stagnated and not gone anywhere fast. On the one hand, profit-taking has kept the metal from adding to its spectacular gains made during the prior several quarters. On the other, weakness in US dollar, central bank buying and continued haven demand amid trade uncertainty and Ukraine war has kept prices supported near the record highs.
Given the short-term uncertainty in terms of directional bias, it may be best to zoom out on the price of gold and discuss long-term technical levels and considerations instead.
Technical analysis: key longer-term levels and factors to watch
Gold has been on a remarkable run, carving out new highs with only the briefest of pauses along the way. The big question as we head into the second half of the year is whether this upward march has further legs, or if a pullback is finally on the cards. Traders, of course, tend to prefer sticking with the prevailing trend unless there’s a compelling reason to switch tack. Yet, gold’s relentless rise is beginning to raise a few eyebrows, with momentum indicators flashing warnings. We have also seen a few bearish-looking monthly candles, but so far, no downside follow-through:
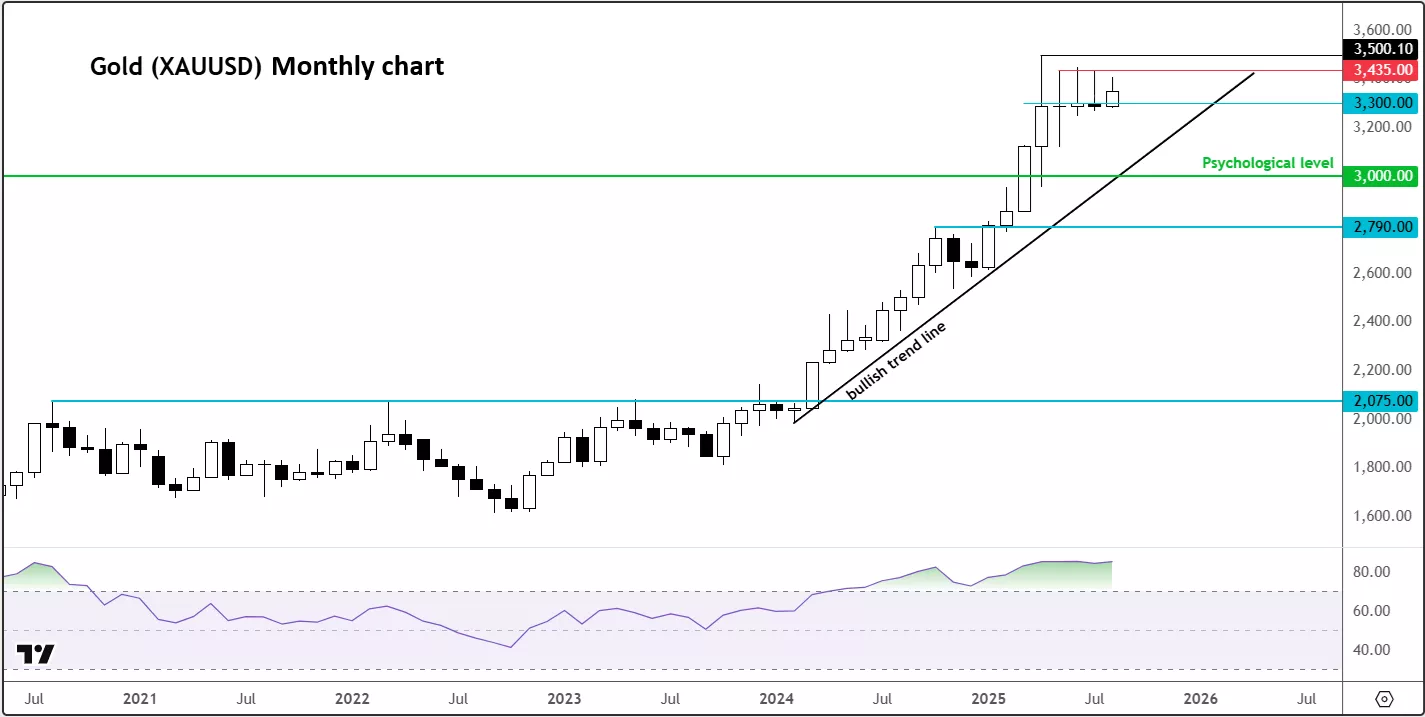
In the last three months, there has been as many doji-like candle candles on the monthly chart. Usually, such candle patterns are associated with market tops or at least a temporary top. But so far, we have not seen any downside follow-thorough. If that changes this month or in the comings and we move below the $3,300 level, and hold below it, then traders should treat that as a major warning.
Meanwhile, the monthly Relative Strength Index (RSI) has been flashing “overbought” since April 2024 and now sits above 85—territory not seen since the COVID-19 rally. Back then, gold needed more than three years of consolidation before mounting its next charge. The only other time in recent memory when RSI was this extended was 2011—just before a major top. Historically, whenever the monthly RSI climbs past 80, it tends to be a signal that a cooling-off period is coming, whether through sideways consolidation or a sharper retreat.
Gold’s weekly chart is still bullish
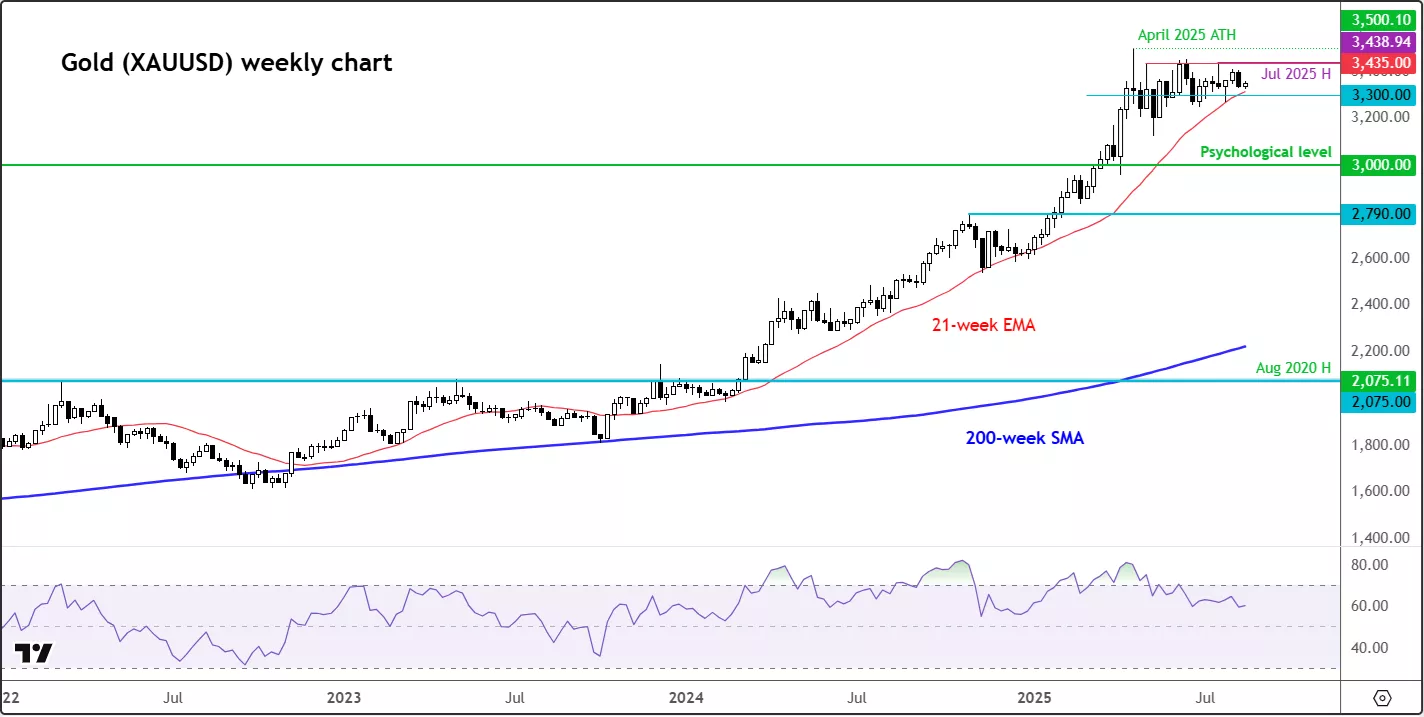
On the weekly chart, things look a touch more forgiving. Since gold’s last record high in April, RSI has eased from the lofty 80 region down to around 63—still high, but less stretched. Importantly, that cooling has come via consolidation rather than a sell-off, which is generally taken as a bullish sign. The RSI, after all, isn’t a sell signal on its own; we’d need to see an actual reversal in price before shifting stance.
Another point worth noting is how far prices are hovering above the 200-week moving average—currently around $1,100 higher. That long-term average sits around $2,200, not far from the long-term breakout zone at $2,070–$2,075. For context, gold would need to shed roughly a third of its value to reconnect with that level. That’s not my base case, but it underlines how extended the move has been. More realistically, the moving average could simply catch up with price if gold treads water near the highs, or pulls back only slightly, before staging its next upward leg (my base case scenario).
Closer in, key support sits at $3,300 level, followed by a bullish trend line at around $3,100, and psychologically crucial $3,000 level.
On the topside, $3,435 remains a stubborn resistance level, while $3,500—the April peak—is the next big hurdle.
So, what to make of gold’s conflicting technical signals?
In conclusion, gold’s directional bias looks balanced. While safe-haven demand may have peaked for now, central bank buying and persistent US fiscal jitters could yet keep the bulls interested. Until the charts tell us otherwise, I am leaning towards buying dips—but with one cautious eye on those overextended technicals.
More By This Author:
Dollar Extends Post CPI LossesGold Prices Dip As Risk Appetite Strengthens
S&P 500: Valuations And Seasonal Factors Could Come Into Focus


