Gold Technical Analysis: The Price Of Gold Is Facing The Strength Of The Dollar
Gold price is now trading near the 100-hour moving average line.
- Despite the strength of the US dollar after investors and markets absorbed the update of monetary policy decisions of the US Federal Reserve last week, in addition to a package of influential US economic releases.
- The Gold price tried to recover from losses that extended to the $1942 support level, with rebound gains that reached the $1963 level.
- It settled around the level of $1958 an ounce at the time of writing the analysis, as the yellow metal gained a positive momentum from the increase in fears about a global economic recession and the increase in global geopolitical tensions.
The US interest rate rose by a quarter of a point, as expected by the Federal Reserve Bank, the bank's policy statement and the bank's Governor Jerome Powell's vague statements to the markets regarding the future of raising the US interest in the coming months. It was then reported that the US economy surprisingly accelerated to a 2.4% annual growth rate from April through June, showing continued resilience in the face of steadily rising interest rates resulting from the Fed's 16-month battle to lower inflation.
The US Commerce Department estimated that gross domestic product - the total economic output of goods and services - rebounded from the 2% growth rate in the January-March quarter. Growth in the most recent quarter was well above the 1.5% annual rate that economists had expected. The growth in the past quarter was driven by a rush of business investment. Excluding housing, business spending rose at an annual rate of 7.7%, the fastest pace since early 2022. Businesses invested more money in plants and equipment. Increased spending by state and local governments also helped support the economy's growth in the April-June quarter.
Gold Technical Outlook
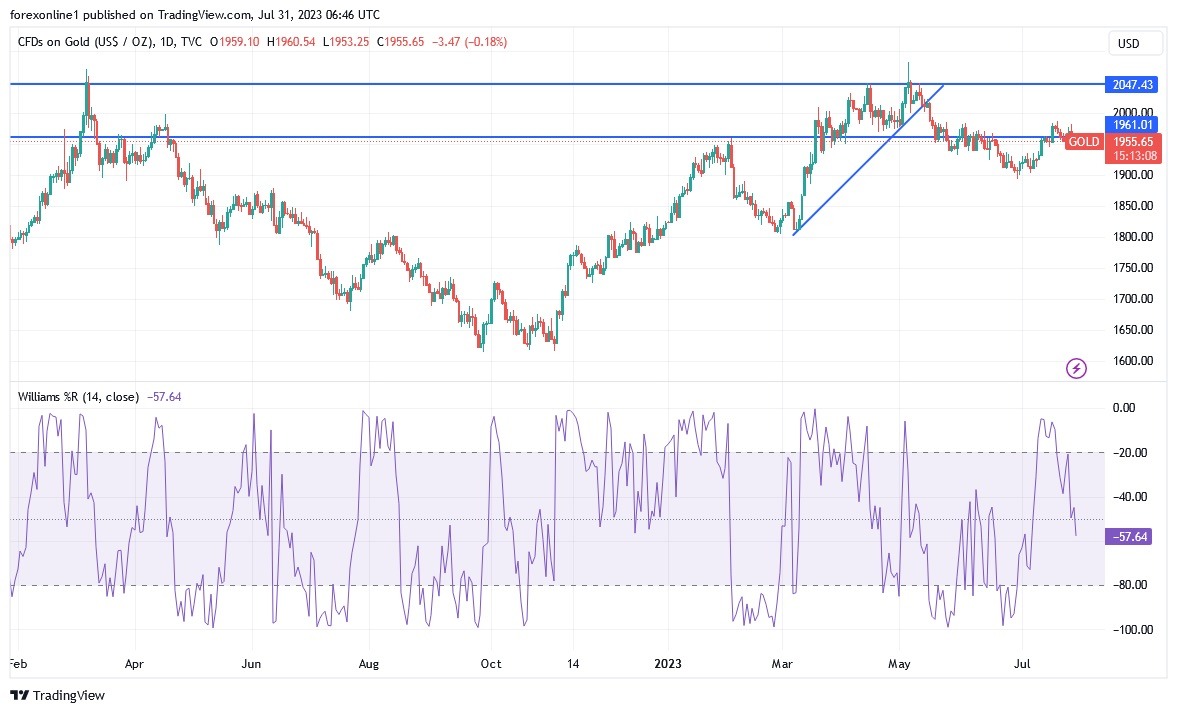
Gold price is now trading near the 100-hour moving average line. As a result, gold price appears to be approaching the overbought levels of the 14-hour RSI. In the near term, and according to the performance on the hourly chart, it appears that the gold price is trading within a bullish channel formation. This indicates a significant short-term bullish bias in market sentiment. Therefore, the bulls - the bulls - will look to extend the current run of gains towards $1969 or higher to $1978 an ounce. On the other hand, the bears will target potential pullbacks around $1952 or lower at the $1943 support.
In the long term, and according to the performance on the daily chart, it appears that the gold price is trading within a bullish channel formation. This indicates a significant long-term bullish bias in market sentiment. Therefore, the bulls will target long-term profits at around $1983 or higher at $2083 an ounce. On the other hand, the bears will target potential pullbacks around $1931 or lower at $1901 an ounce.
(Click on image to enlarge)

More By This Author:
BTC/USD Forex Signal: Threatening Bullish BreakoutForex Today: Asian Stocks, US Dollar Rally
Weekly Forex Forecast – Nasdaq 100 Index, S&P 500 Index, EUR/USD, USD/JPY, Cocoa Futures
Disclosure: DailyForex will not be held liable for any loss or damage resulting from reliance on the information contained within this website including market news, analysis, trading signals ...
more


