

Image Source: Pexels
Gold (XAUUSD) trades under pressure as improving risk sentiment limits safe-haven demand. The recent Israel-Iran ceasefire has eased geopolitical concerns. However, gold remains supported by a weakening US Dollar and growing uncertainty around the Federal Reserve’s policy outlook. Investors now await key economic data for further direction. Amid mixed signals, gold stays in focus as market dynamics shift.
Gold Price Struggles as Risk Sentiment Rises and US Economy Weakens
Gold prices remain under pressure as risk sentiment improves following the Israel-Iran ceasefire. This positive geopolitical development reduces safe-haven demand, causing gold to fall below the $3,300 level. However, gold still finds support from a weakening US Dollar and cautious investor sentiment ahead of key US economic data.
The US economy is showing signs of slowing, with GDP contracting more than expected in the first quarter of 2025. Consumer spending remains soft, and unemployment claims continue to rise. These factors increase the chances of a Fed rate cut in the coming months. A lower interest rate environment typically boosts gold as it reduces the opportunity cost of holding the non-yielding asset.
Investors await the US PCE Price Index data for further direction. A weaker-than-expected reading could strengthen the case for rate cuts, keeping the US Dollar on the back foot and supporting gold. Meanwhile, concerns over Fed independence and political pressure add further uncertainty. These fundamentals suggest gold may remain supported in the near term despite current selling pressure.
Historic Gold Breakout Signals Start of Long-Term Bullish Trend
The gold chart below shows a historic breakout above long-term resistance, signaling a new bullish era. The diagram shows a massive cup-and-handle formation that took over a decade to complete. The base of the cup was formed from 2011 to 2015, with consolidation lasting until 2019. The handle developed from 2020 to 2023, followed by a breakout in early 2024.
(Click on image to enlarge)
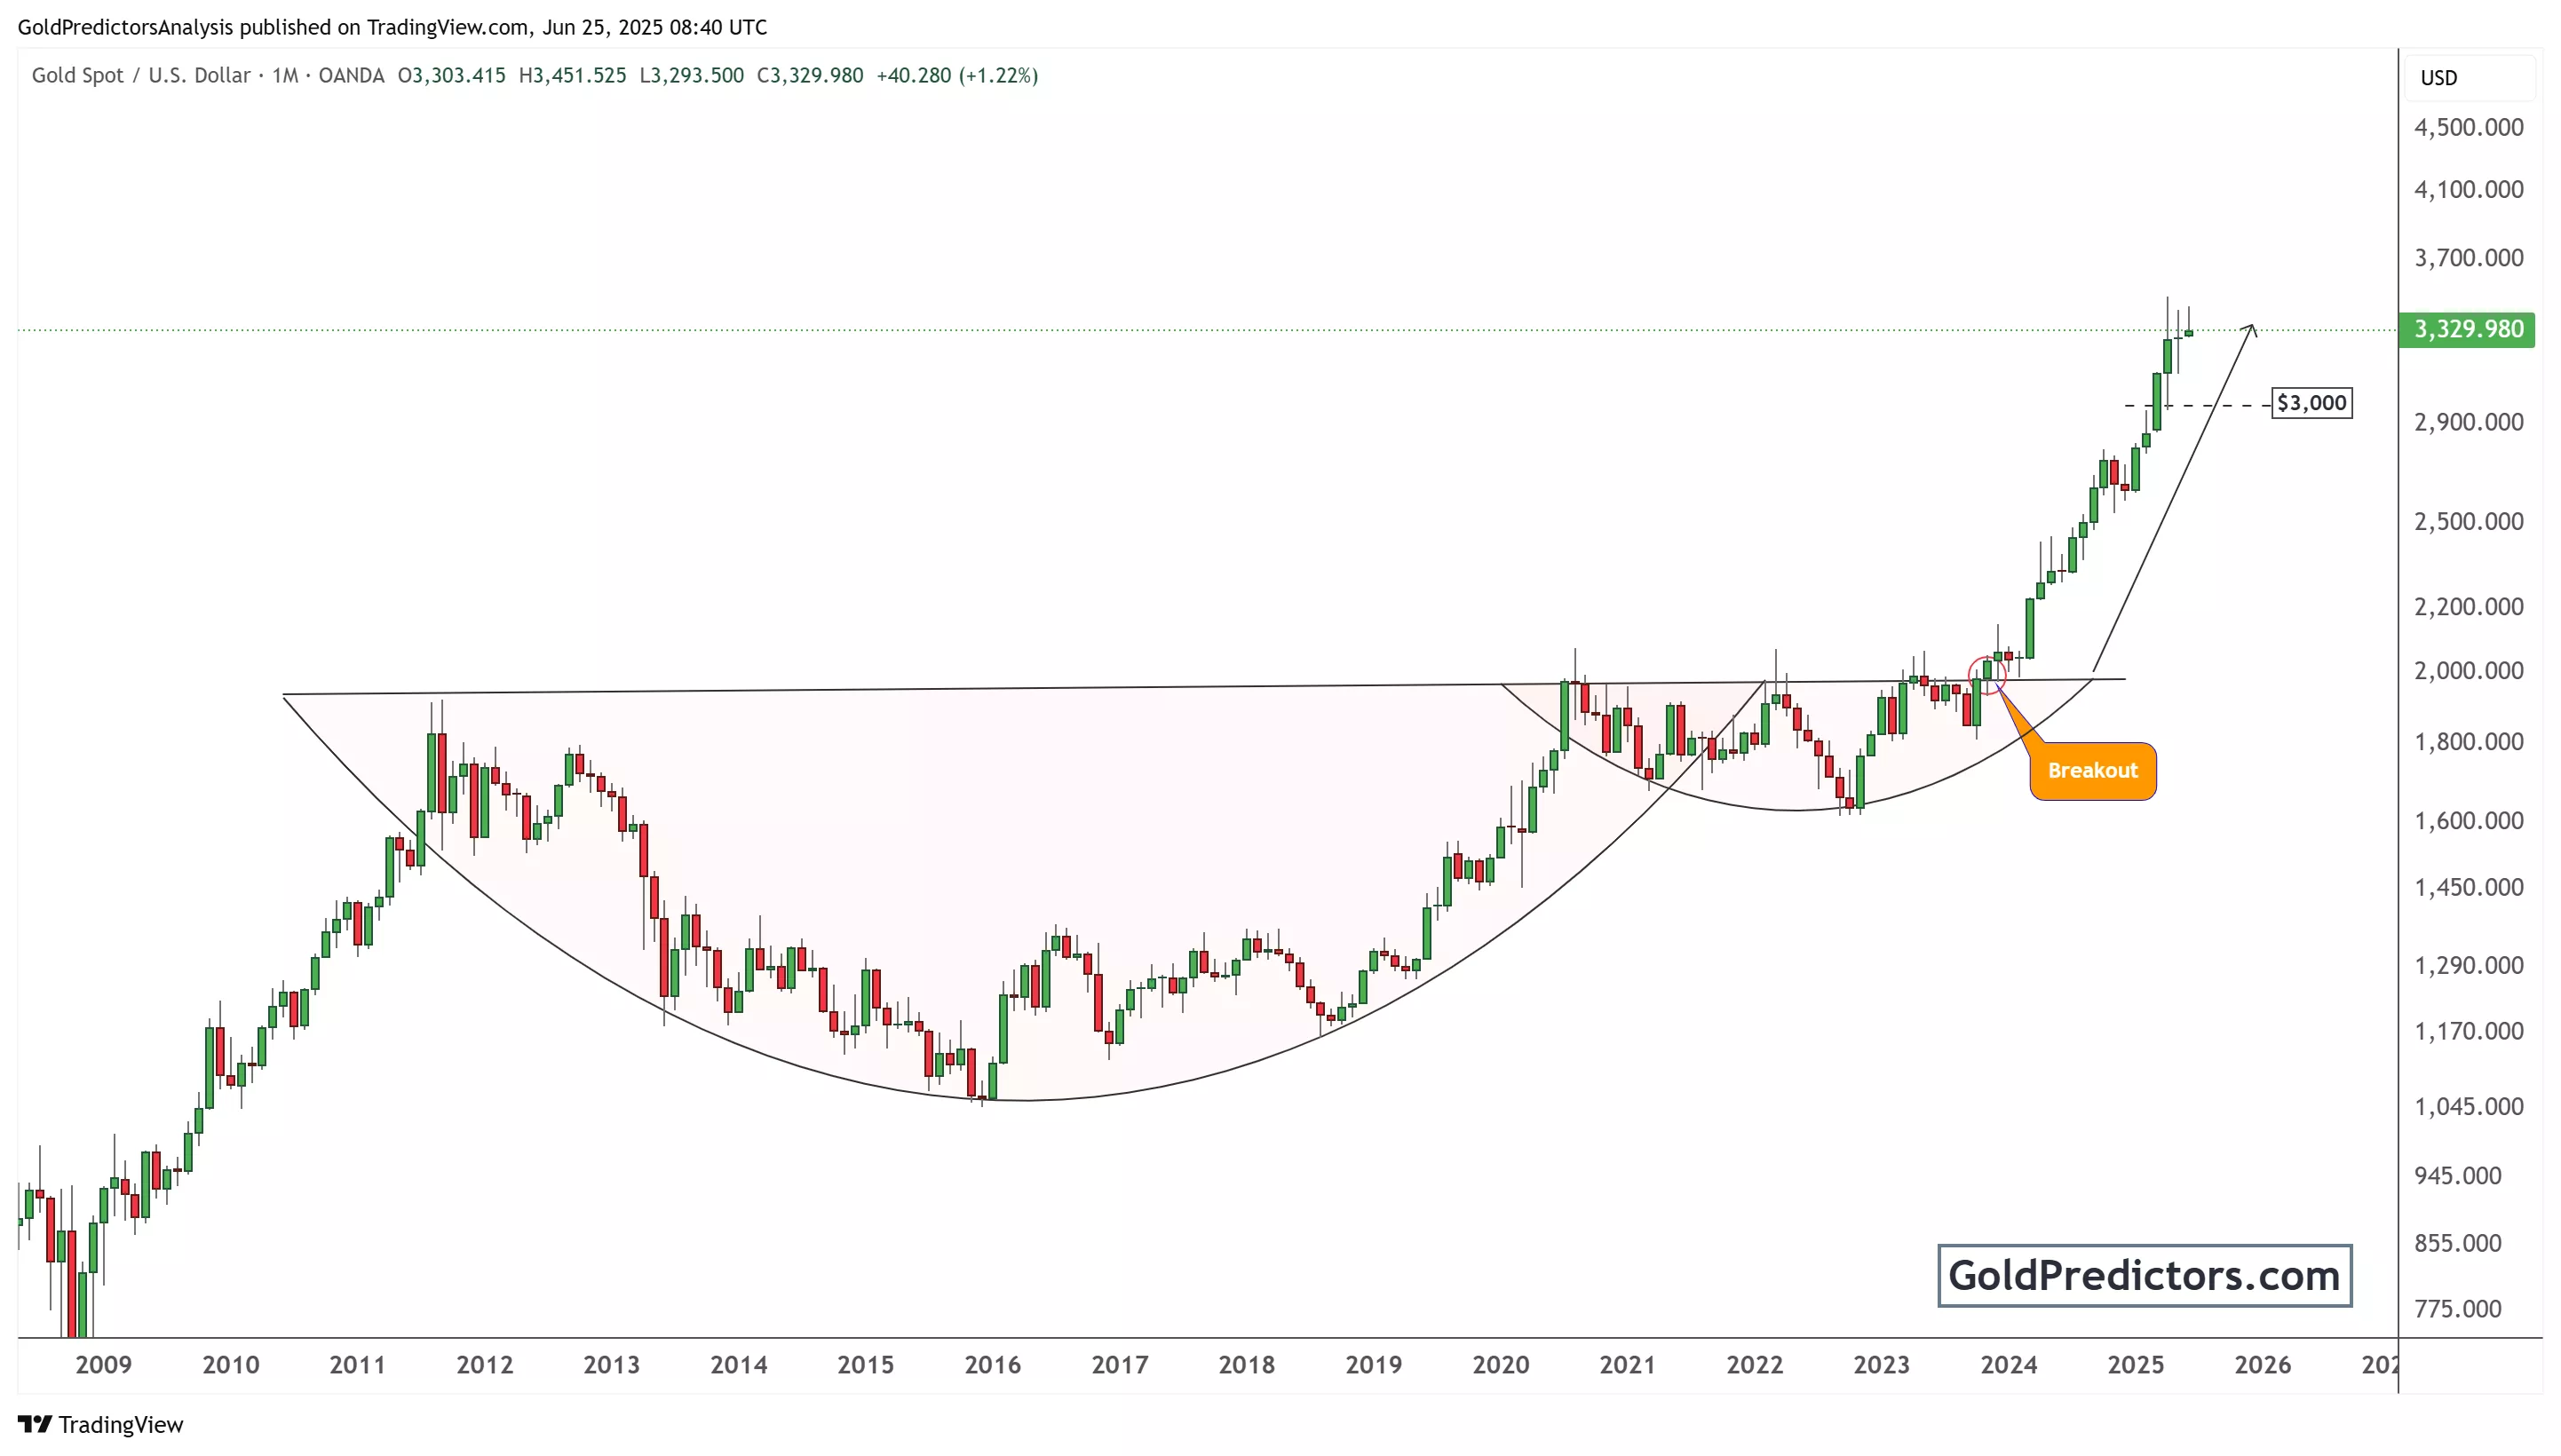
This breakout occurred at around $2,100, the previous all-time high. After breaking out, gold surged past $3,300. The breakout is technically significant as it confirms the end of a multi-year consolidation. Gold now trades in a strong upward channel, with immediate support seen near $3,000. This level will likely act as a floor during any short-term pullbacks.
The long-term price structure supports further gains. The rounded base reflects substantial accumulation over time. Price action following the breakout shows consistent bullish candles with higher highs and higher lows. This confirms buyer dominance and increasing momentum. If this structure remains intact, gold could aim for $4,000 and beyond in the coming months.
Conclusion
Gold remains under pressure, but strong technical and fundamental signals suggest continued long-term strength. While easing geopolitical tensions have reduced safe-haven demand, a weak US Dollar and growing expectations of Fed rate cuts support the bullish case. The breakout above multi-year resistance confirms a major shift in market structure. As long as key support levels hold, gold is likely to resume its upward trajectory, with potential targets well above current levels.
More By This Author:
Gold Holds Steady As Markets Eye Fed Moves And Middle East Risks
Gold Prices Slip After Israel-Iran Ceasefire As Traders Eye Powell’s Testimony
Gold Breakout Signals Bullish Trend Despite Fed Caution And Geopolitical Uncertainty


Comments
Log in or sign up to join the conversation.