Gold Stocks: A Meeting With Michelangelo
Last week featured some wild trading for gold. The Dec 3 Sunday night price surge to $2145 and Friday’s jobs report certainly shocked a lot of gold bugs.
Could this week be the same? Well, a US CPI report surprise today could create a shocking FOMC announcement tomorrow. Could there be a final hike?
Investors in ultimate money gold need to stay focused on the big picture and on buy and sell zones of significance.
On that keynote:
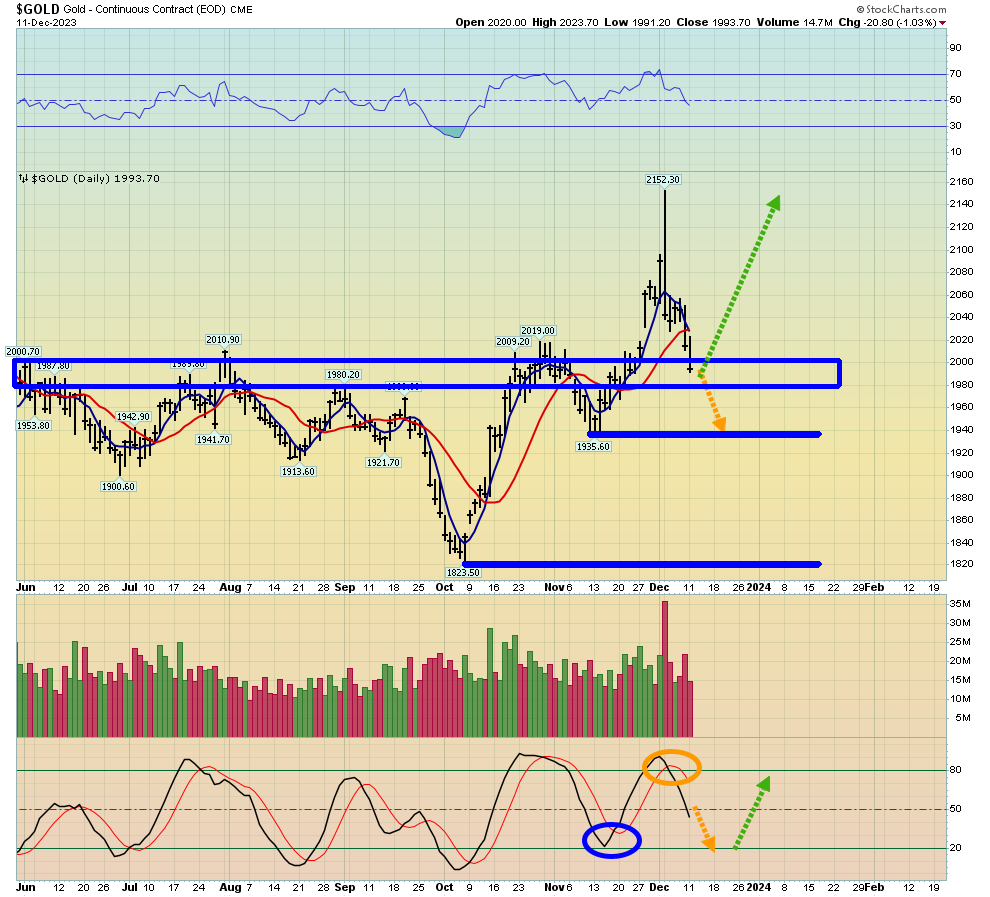
(Click on image to enlarge)

daily gold futures chart.
While the price could dip to the November low, the big question for investors is this:
In the coming year, will positions bought now rise to a juicy profit or not? The answer is most likely a resounding yes.
For some insight into what’s driving gold going into the new year:
(Click on image to enlarge)

US rates chart.
Gold usually rallies as rates fall, but it can also rally as rates rise if inflation is seen as getting out of control.
Rates dipped to their 4.09% early March low from about 5% in October. That, combined with the horrifying Hamas-Israel war cycle action, helped gold stage a beautiful rally to above $2080.
Now rates are at 4.10% support. A rally is expected, and it’s underway.
Also:
(Click on image to enlarge)

daily dollar index chart.
There’s a small H&S bottom in play. It’s in sync with the action in the interest rates market.
For an alternative interpretation of the dollar chart:
(Click on image to enlarge)

This interpretation is also valid, and it’s one reason why I’m a buyer of gold at $1985.
What about oil? Oil is especially important right now because it may resolve the debate about the CPI, gold, and rates.
(Click on image to enlarge)

Oil may be bottoming. There’s a three wave decline in play from my $93 sell zone and…

The 2021-2025 war cycle still has 2 years to go. If the next major action involves opponents of the Israeli government successfully limiting oil supply from the Mid-East, oil could race back to $100… and higher.
For another look at the oil price chart,:
(Click on image to enlarge)

Here, I’ve added US rates to the top of the chart.
The relationship between oil, rates, and gold is complicated. Note that as rates tumbled from their October high, oil fell while gold surged. A rising price of oil can initially see gold dip, but as it begins to affect the CPI, gold races higher!
Most mainstream analysts may be a bit “behind the curve” right now. Their focus is on the economy slowing. That’s important, but only part of the big picture.
A FOMC announcement-driven dip in gold towards the November low of $1935 futures ($1928 cash) during the current Indian wedding and Chinese New Year buying season could see the kind of massive physical market buying that savvy COMEX commercial traders respond to with heavyweight buys of their own.
Hedge funds typically focus on the Fed, the CPI, GDP, and other Western market indicators. Sadly, they have a history of not faring well in the gold market with that approach.
In contrast, the commercial traders tend to focus more on physical market supply and demand, and their track record is stellar.
Whether there’s a dip to $1928 or price bottoms here around $1985 is likely determined by today’s CPI and tomorrow’s FOMC announcements. Either way, physical market demand and commercial trader buying appears set to begin intensifying from the current price level.
What about the miners? As noted, my focus for investor buying here at $1985 is gold bullion. At $1928 it will be the miners and silver. Having said that, gold stocks could bottom here. Investors need to be positioned for this scenario too.
(Click on image to enlarge)

spectacular GDX daily chart.
With gold taking a hit yesterday, individual miners (especially in the silver sector) showed some very bullish candlesticks, and GDX did too.
The H&S formation on this GDX chart is magnificent. In a nutshell, this incredibly bullish pattern for the miners looks like it was carved into gold bull era marble by Michelangelo himself. Enjoy!
More By This Author:
$2010 & $1985: Golden Stocking Stuffers
Gold Bank Analysts Vs COT Traders
Gold Stocks Outperformance Begins Now


What 😂😂😂 inflation is over 20% if you add in Energy, Housing & FOOD! The FEDS take out, Revise & Manipulate anything that shows TRUE inflation!