
Gold Stocks: A Bullish Wind Begins To Blow
The 2021-2025 war cycle and bank crisis headlines make it easy for investors to lose their gold market focus. The Fed’s balance sheet action and Indian demand trends are important, but in the short term, are they more important than today’s COMEX gold option expiry?
The bottom line is that the big picture matters, but investors will be ground up like hamburger meat if they lose focus on the key buy and sell zones for gold.
(Click on image to enlarge)
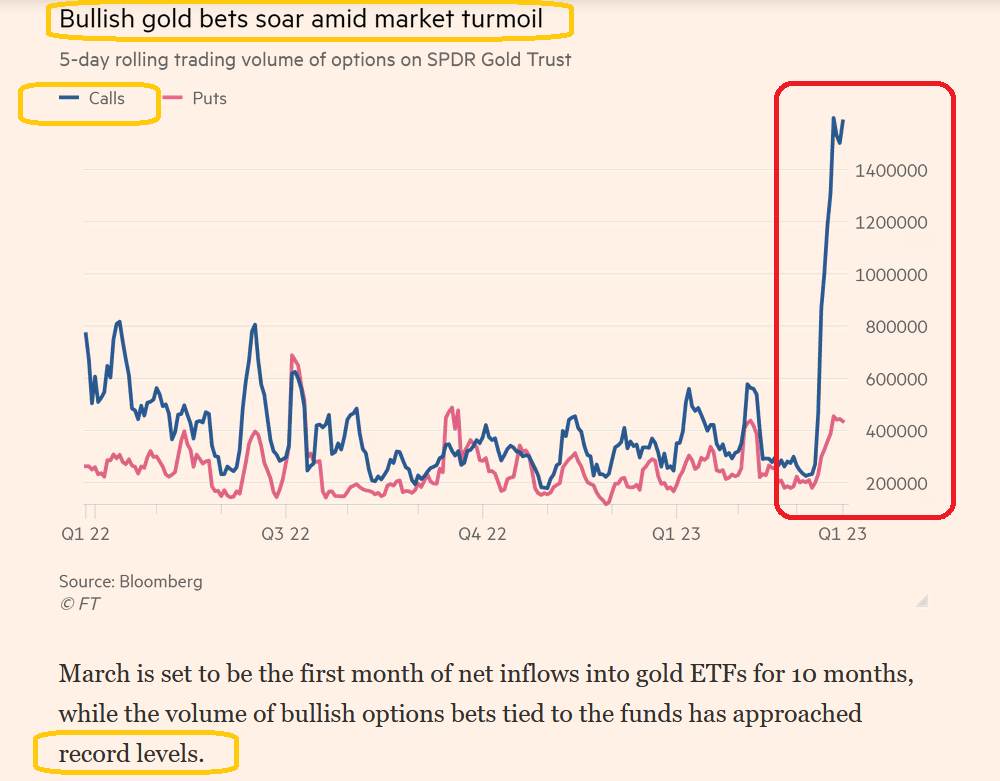
stunning COMEX gold option chart.
Gold option gamblers bought near-record amounts of call options… but only after gold soared from my buy zone of $1808 to my sell zone of $1960-$2000.
Option writers tend to be smart money commercial players with deep pockets. The gamblers are in trouble, but the good news is that with gold down about $60-$70 from the $2010 area highs, the dumb money bets end today, likely in failure… and that makes gold a stronger market.
(Click on image to enlarge)
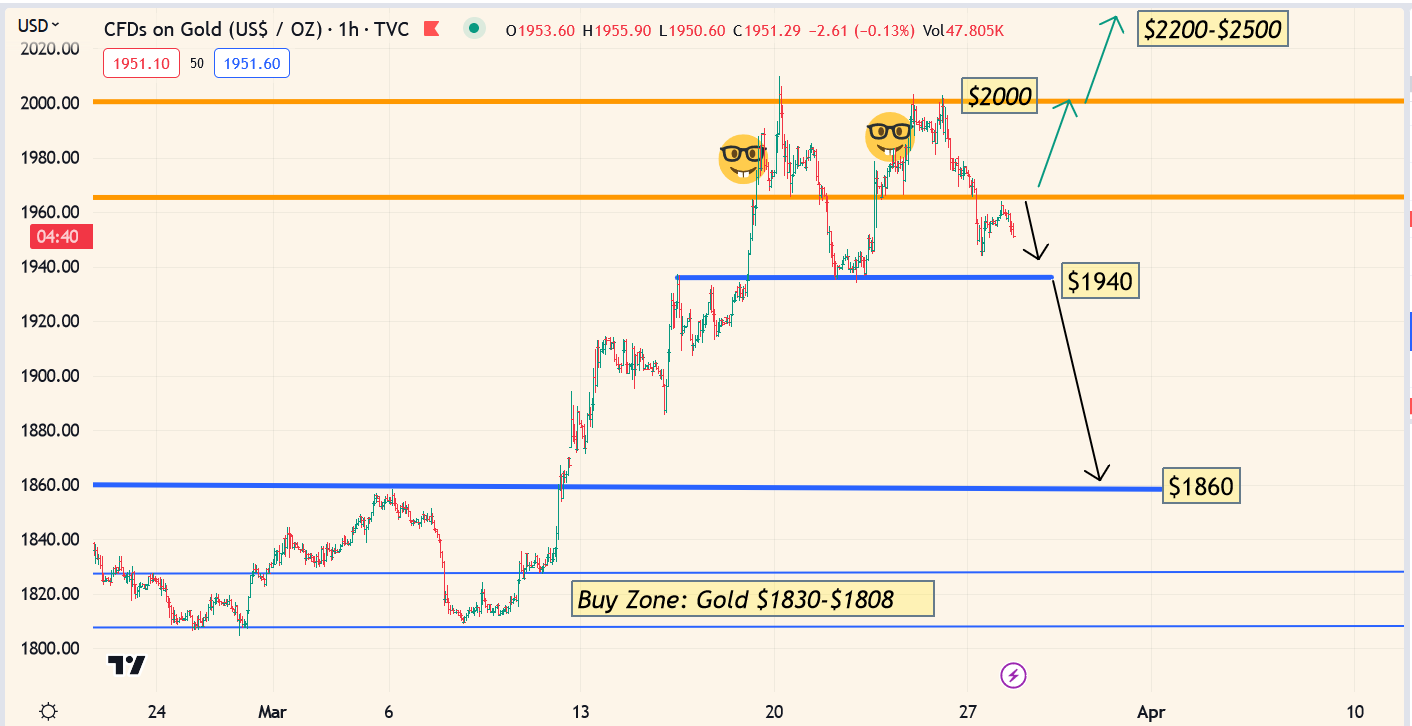
There’s a double top pattern in play, with each high near the important $2000 zone.
If the neckline around $1940 fails, gold could correct more significantly, perhaps to $1860 or even all the way back to $1808. Traders and gamblers can buy the $1940-$1935 zone with a modest size and a stop at $1930.
(Click on image to enlarge)
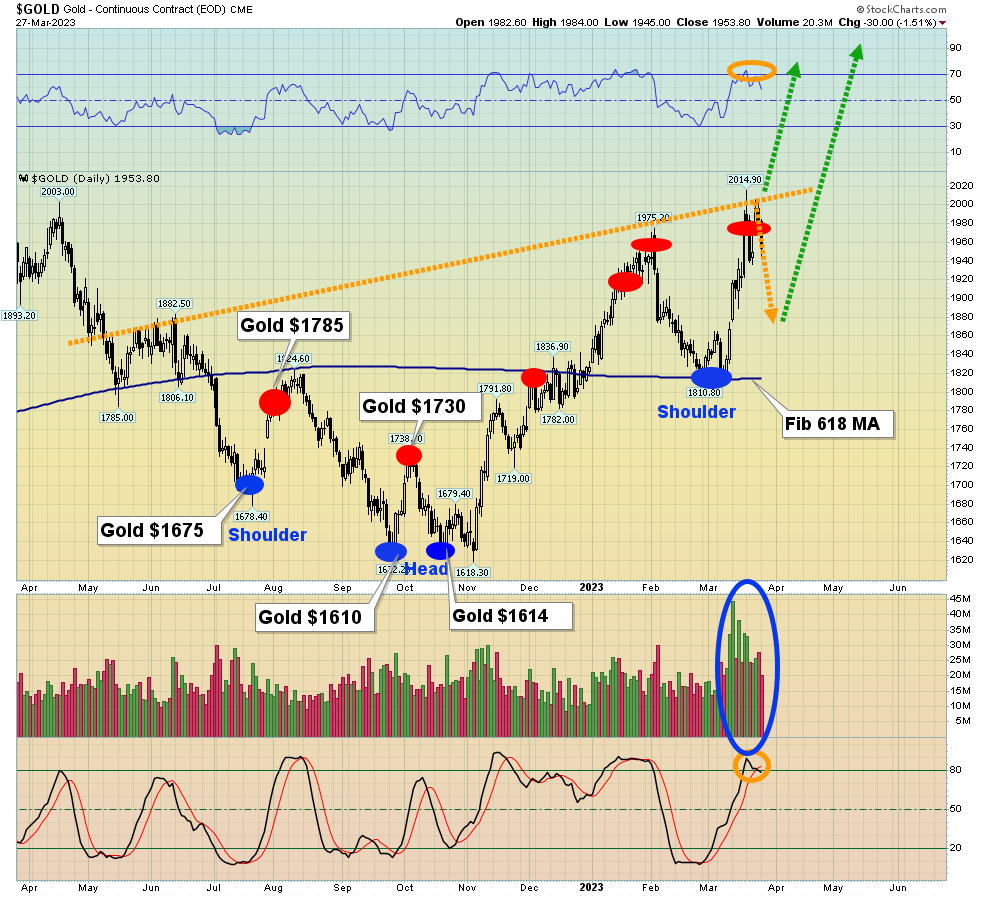
A very large but loose inverse H&S bottom pattern is apparent, and the target is about $2300.
The upsloping neckline and high right shoulder are likely related to the growing global instability created by the US government’s insane decision to engage in debt-funded war mongering in a major war cycle, and by a loss of depositor confidence in the banking system.
For a look at the weekly chart:
(Click on image to enlarge)
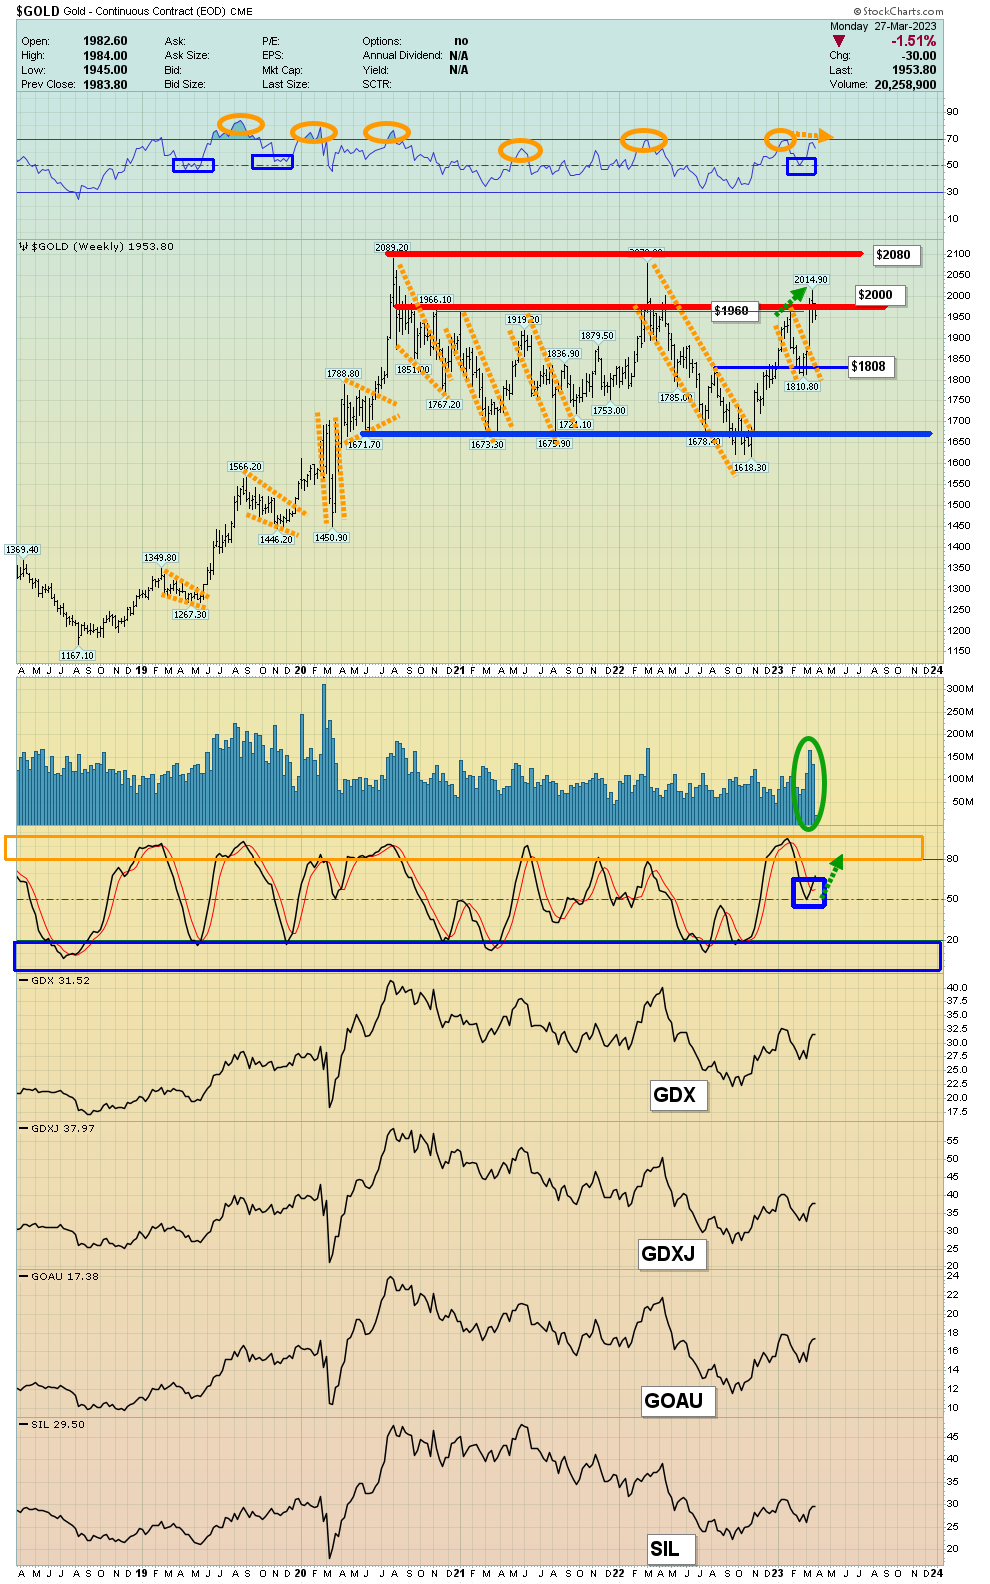
The daily chart H&S pattern sits within a huge weekly chart rectangle continuation pattern… and that rectangle now targets the $2400 area.
(Click on image to enlarge)
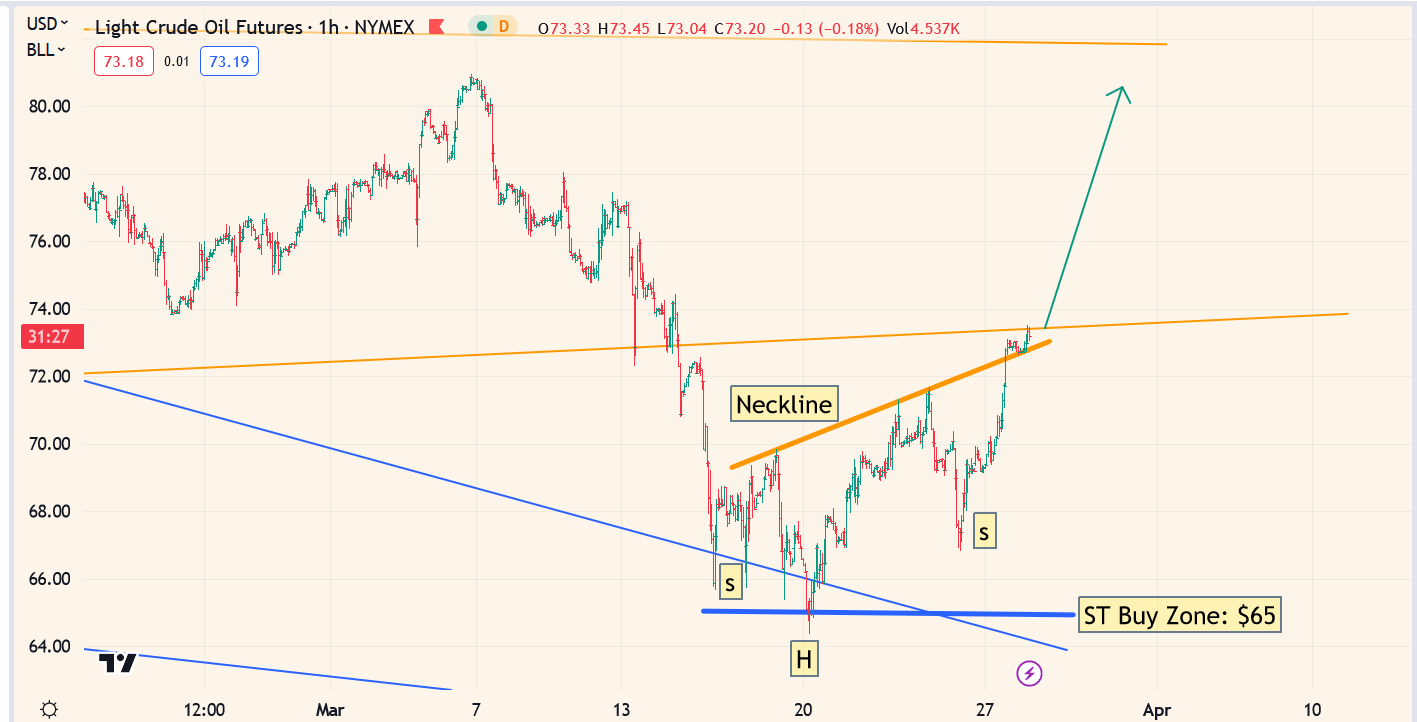
short-term oil chart.
I recently urged investors to take note of the change in tempo; the price action has become “spikey” and now there’s a possible inverse H&S pattern breakout.
The head of the pattern formed at my $65 buy zone. Interestingly, this pattern may become the head of a much larger inverse H&S pattern.
On that note:
(Click on image to enlarge)
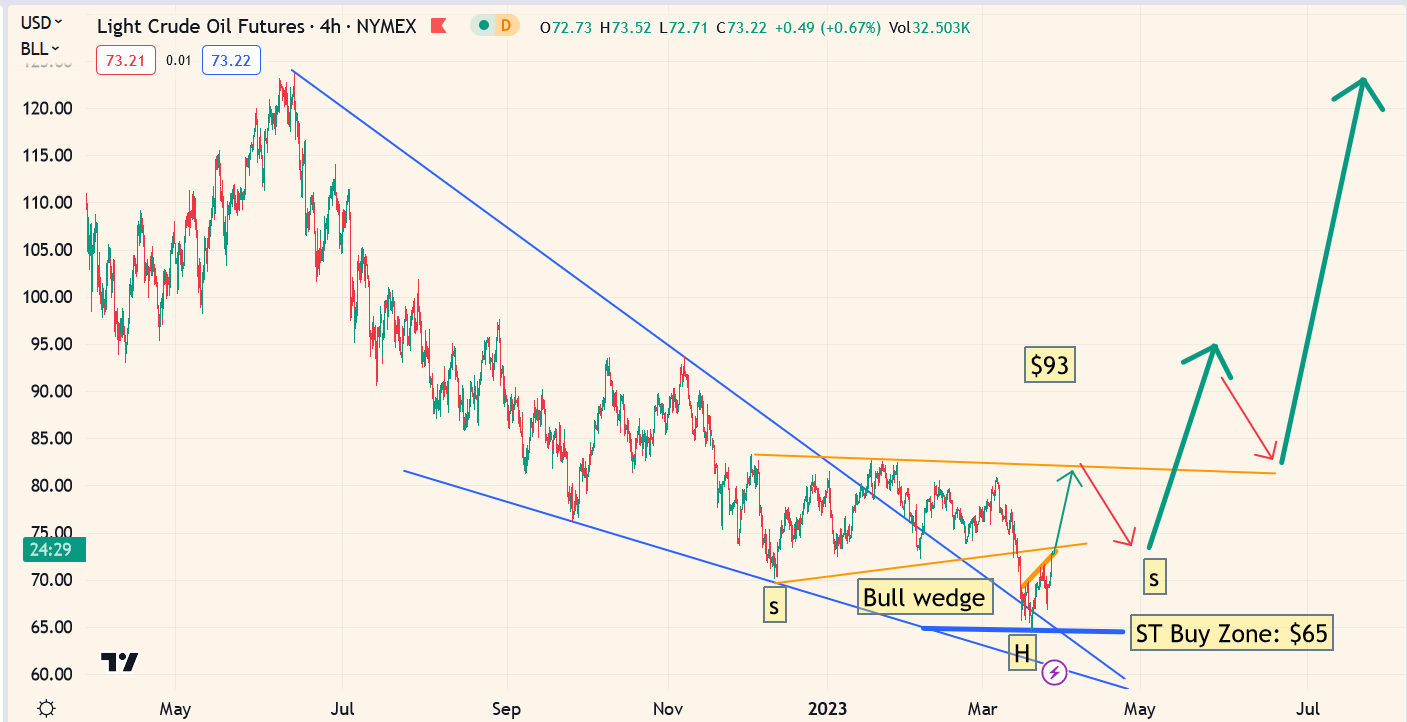
I warned investors that the initial bull wedge breakout would almost certainly take the form of a multi-month drift, and it did. As is often the case with bull wedge breakouts, the price oozes sideways to lower and ends up near the apex of the pattern.
Oil is now coming to life. It’s likely that President Chicken Hawk (Biden) wants to employ the same type of mark-to-model accounting (lies?) that the banks use to hide unrealized losses on their T-bond holdings… and apply that accounting to the strategic oil reserves.
President Chicken Hawk and his entourage of warmongers need the oil price to stay down so millions of heavily armed US citizens don’t engage in a real insurrection. That gives him breathing room to work on what appears to be his current goal; creating a civil war in China and Russia.
I’ve predicted that he’ll fail and oil will ultimately rise not just to the $130 area highs, but to $200. When it does, all the mayhem the government has tried to orchestrate in China and Russia will instead happen… on the streets of America.
(Click on image to enlarge)
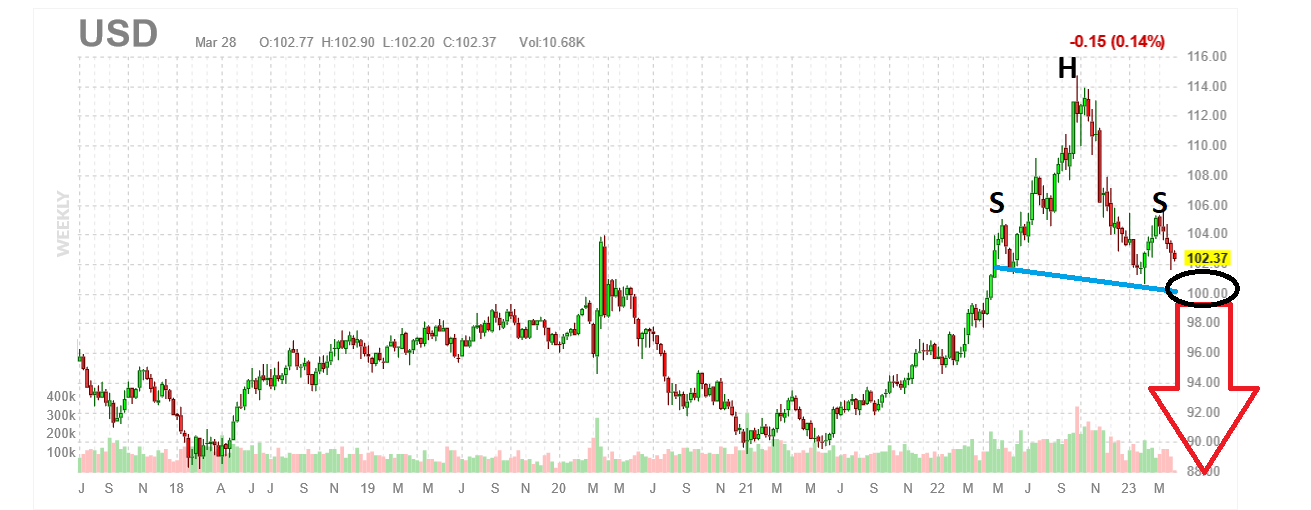
horrifying US dollar index chart.
A move down through the key 100 zone would likely coincide with another loss of confidence event in the banking system… and a surge to $2200-$2400 for gold.
If oil keeps rallying, Main Street inflation would begin a fresh leg higher… and the armed citizens of America will become restless.
Most pundits yearn for more money printing and a Fed that blinks. What’s most likely is a combination of more money printing… and more rate hikes too. More inflation will be countered with more hikes, and more hikes will cause more banks to fail. That will lead to more money printing. It’s a vicious cycle. Americans are entering a stage in their empire’s demise where the nation will begin to take on more qualities of failed states like Venezuela.
A fiat nation is a socialist nation. Fiat is the main driver of loose morals, debt, and all the other pillars of socialism. American gun violence, drug use, and rampant crime can be traced to both political parties embracing socialist fiat money. This won’t change, so the empire is doomed. Because gold is the only solution, gold bugs will be the survivors.
What about the miners? Well, I’m impressed with the price action of individual miners. ETFs like GDX, GOAU, and GDXJ have recently rallied on down days for gold.
(Click on image to enlarge)
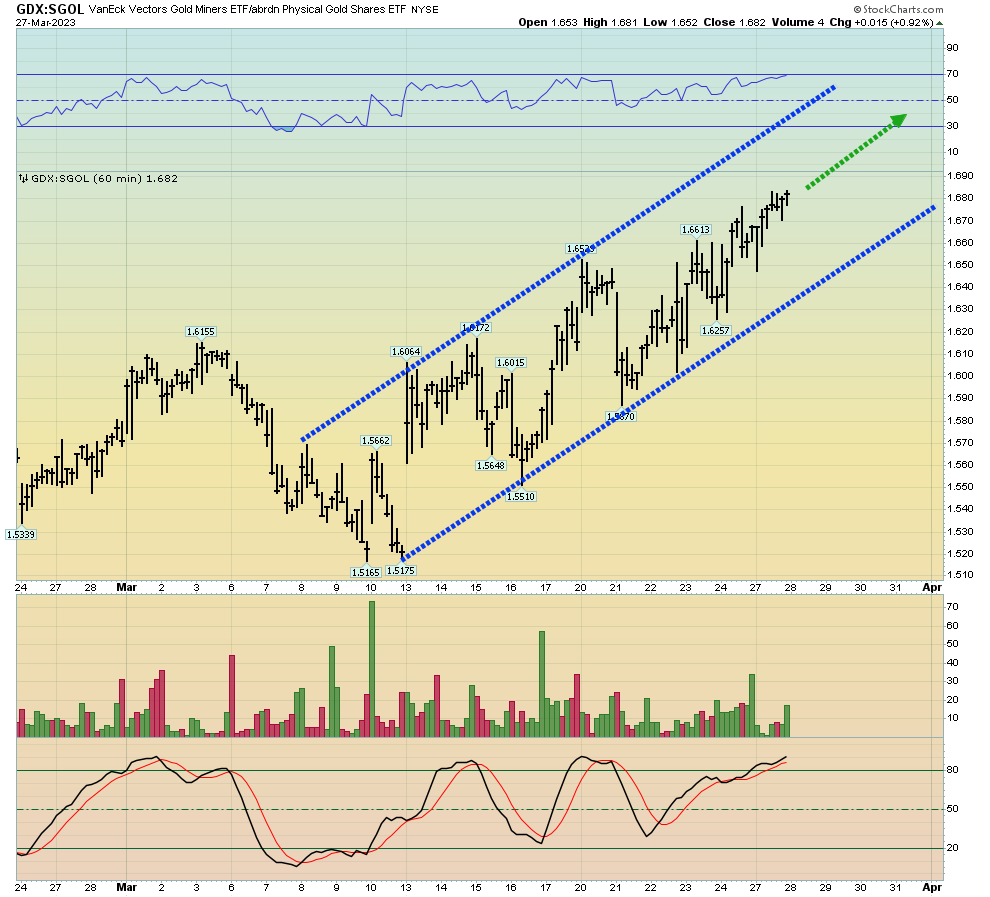
GDX versus SGOL (gold bullion proxy) hourly chart. The rising channel is solid.
For a look at the GOAU chart:
(Click on image to enlarge)
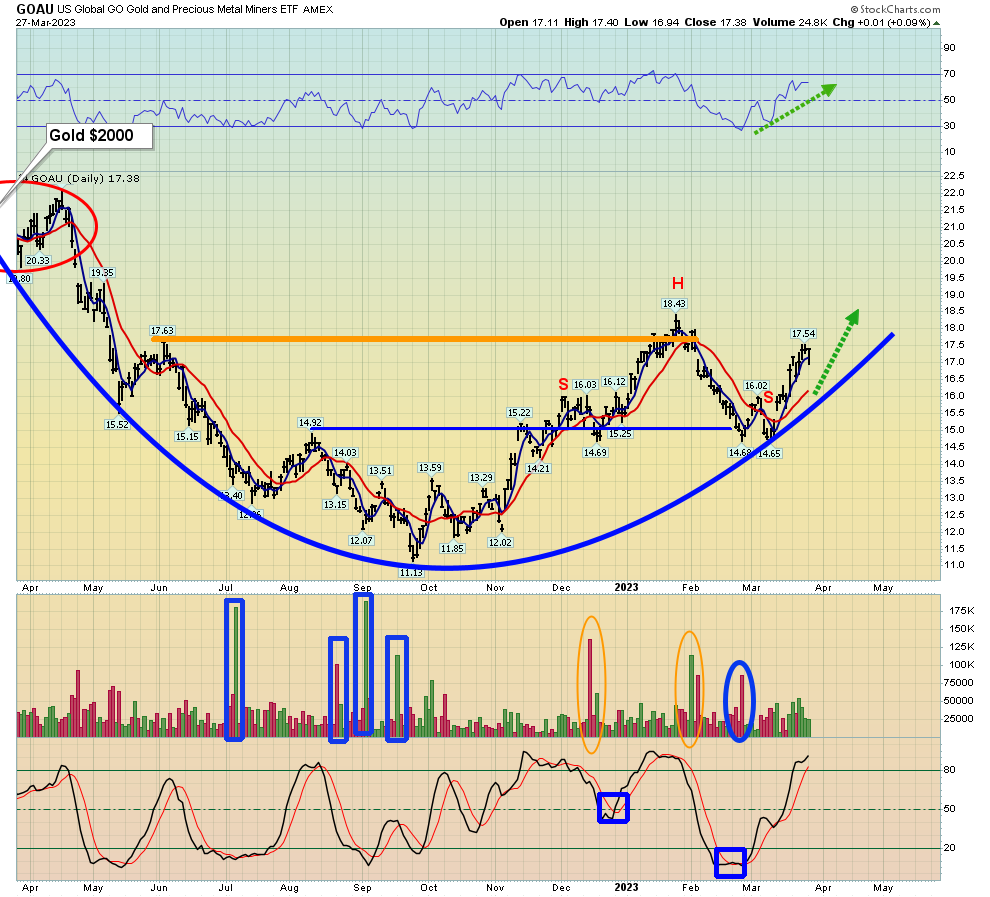
The small H&S top is destroyed, and the C&H (cup and handle) continues to take shape nicely. There’s also no sign of blow-off volume. As mainstream money managers see that rate hikes and money printing are here to stay, they will turn to the miners.
While some profits need to be consistently booked into strength (like mowing a lawn), investors have good reason to feel a very bullish wind for gold and silver stocks is suddenly blowing… in warm gold bull era air!
More By This Author:
The Fed Meet & Weekly Gold Chart Stochastics
Gold A Bull Era Pac-Man
Gold & The Jobs Report: Investor Tactics


