

Image Source: Pixabay
Are the summer doldrums here for gold or is it the calm before a big storm? In a nutshell, there’s a lot going on and that can cause significant investor confusion. Some key items of note:
Donald Trump is a workaholic, and he has a rock star personality. He has his fingers in a lot of pies. Also, Jay Powell has a big Jackson Hole speech on Friday.
To help clarify the situation for gold,
(Click on image to enlarge)
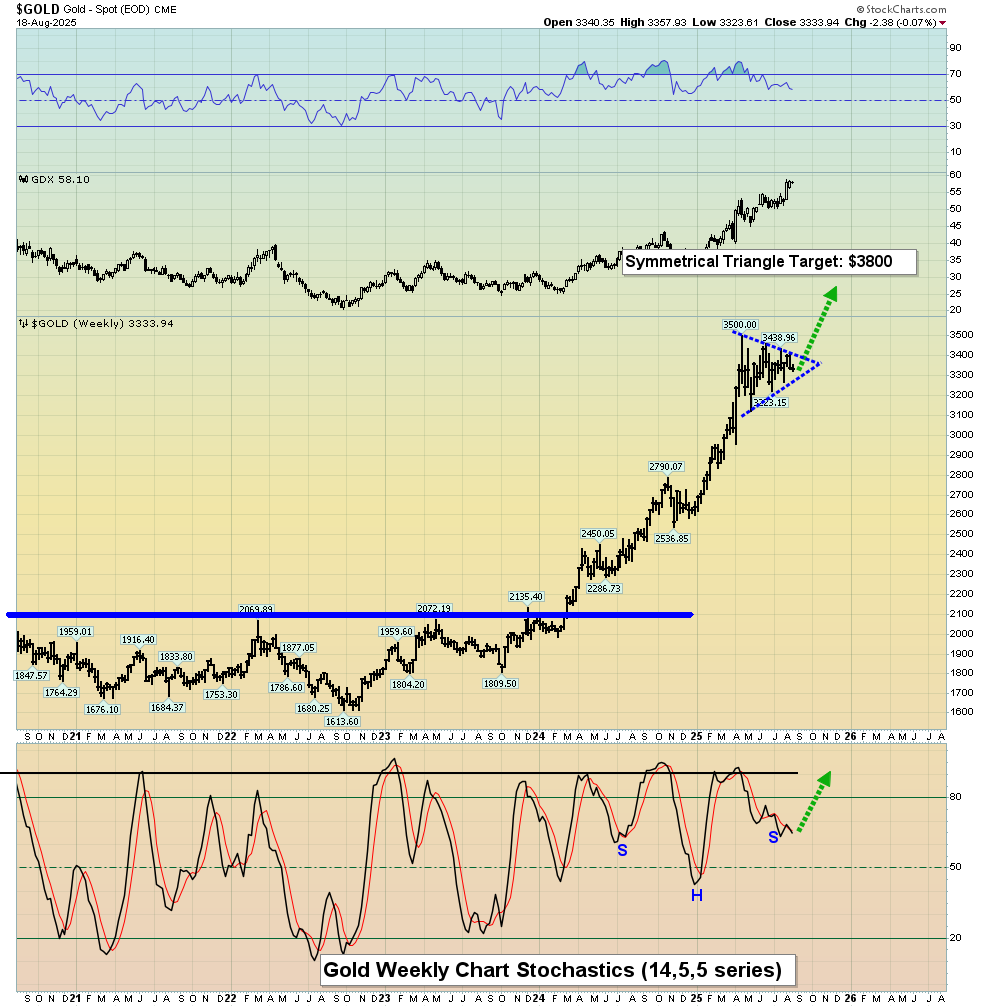
weekly chart
Suddenly, the clouds are gone, and the gold market sky is clear; a simple triangle formation is in play.
The odds (basis Edwards/Magee) are about 67% in favour of an upside breakout. All that’s required of investors is… patience.
On the Stochastics oscillator there’s an interesting but choppy inverse H&S pattern.It supports the case for a surge to $3800-$4000 as the next big event for gold.
For a look at the daily chart,
(Click on image to enlarge)
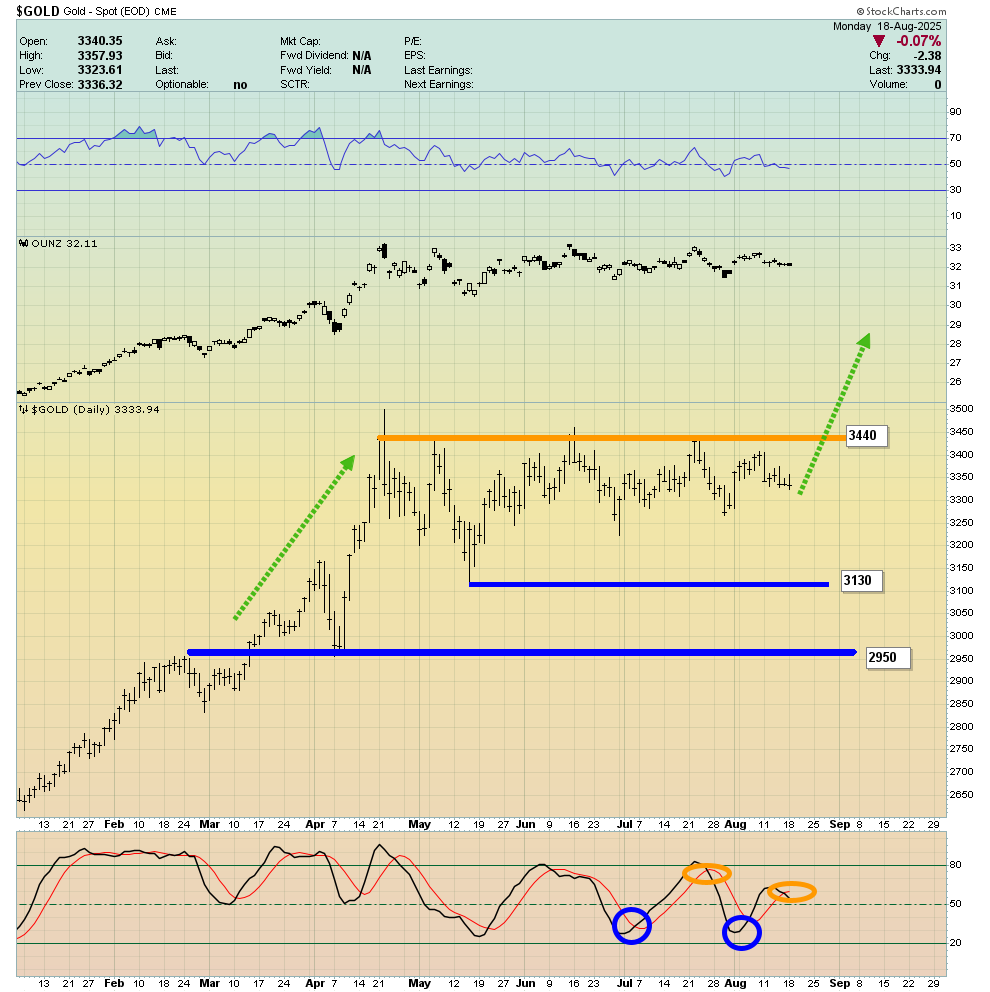
Gold hit $3500 in late April and has been trading sideways for about four months since then.
There is a pattern of generally higher lows within that range trade which supports the bulls.Some analysts have tried to “top call” the market, but that hasn’t worked well for them.Even though gold has almost doubled from its $1800 low in 2023, there’s been barely any retracement of that powerful move.
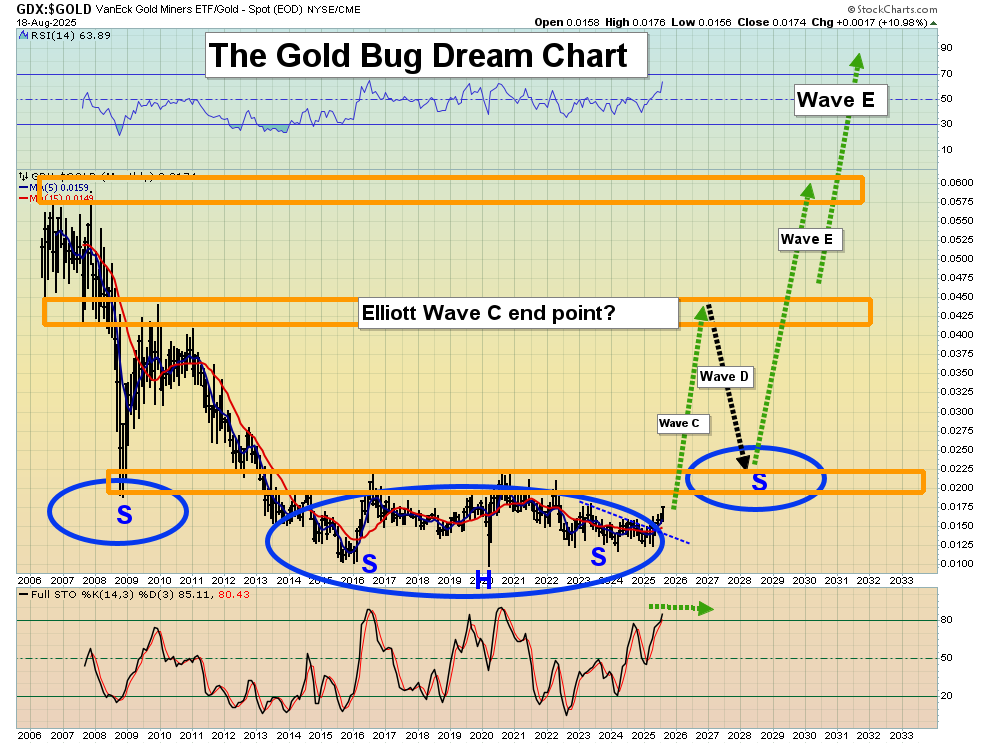
There’s more great news, which is that gold stocks generally keep making higher highs even while gold trades sideways!
On that exciting note,
(Click on image to enlarge)
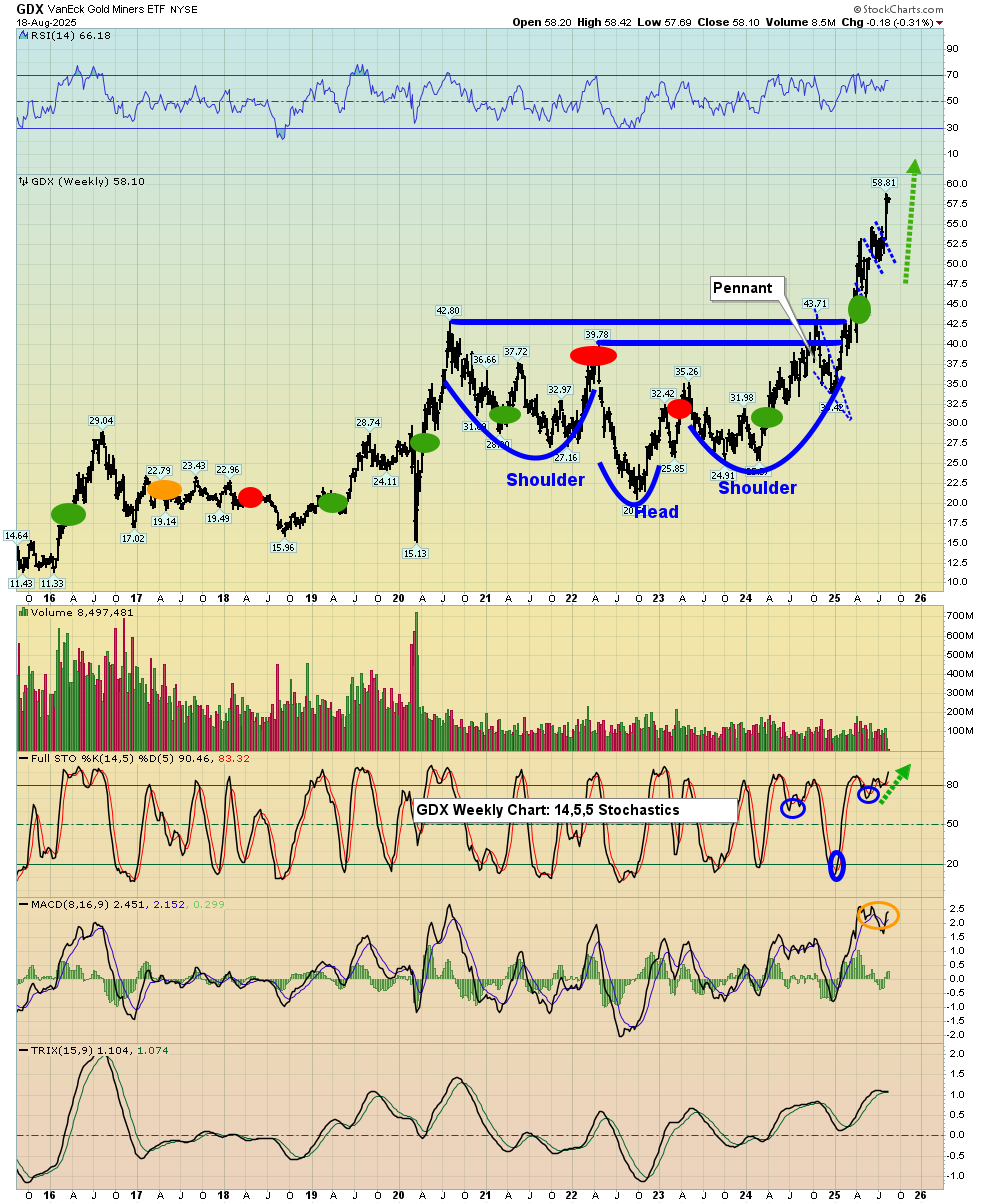
stunning GDX weekly chart
From my October 2023 (gold $1810) buy zone, senior gold stocks have leapt into upside action.
In a nutshell, it’s been almost non-stop bull pennants and flags since then.The big question is: Can it continue?
Well...
(Click on image to enlarge)
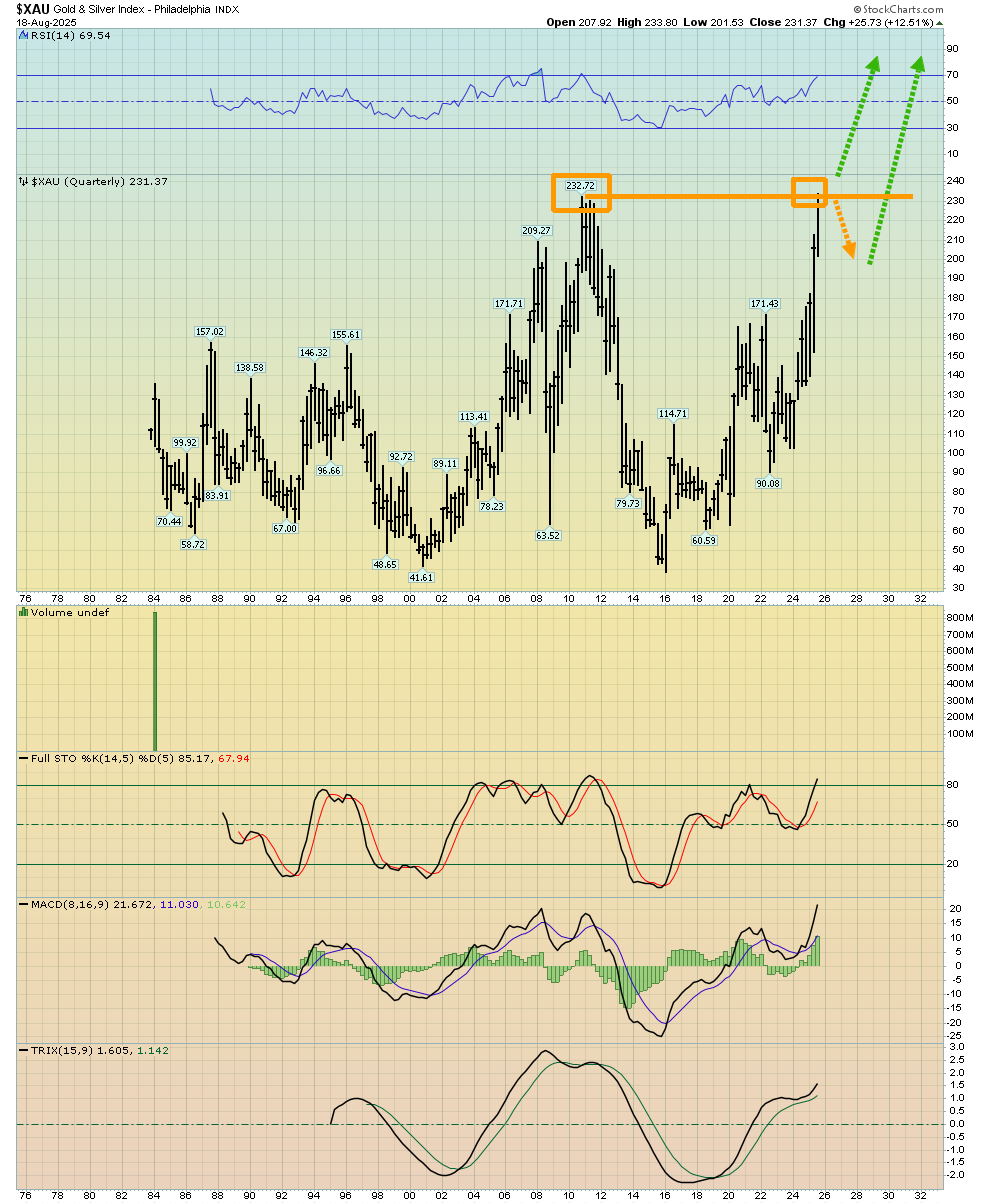
long-term XAU gold stocks index chart
It’s reached all-time highs.A pullback would be typical and expected to occur.
Next,
(Click on image to enlarge)
The BPGDM sentiment index has reached the 100 level.
In a normal market, this event would be accompanied by incredible speculative froth, as it was in 2016 and 2020.
It’s important to note that most investor sentiment indexes are technical indexes. They showcase the action of moving averages, new highs and lows, etc. That means they may, or may not, reflect actual investor sentiment.In the current market, gold stocks are being bought by calm professional money managers and not by greedy amateur investors.
This is probably the first time in history that the BPGDM has gone to 100 and actual retail investor sentiment is in almost the exact opposite state of what the index shows. That’s incredibly bullish for the miners.
Also,
(Click on image to enlarge)
one of the most spectacular base pattern breakouts in the history of markets
Actual amateur investor sentiment is about as low as gold stocks are on this chart… and that’s bullish.
(Click on image to enlarge)
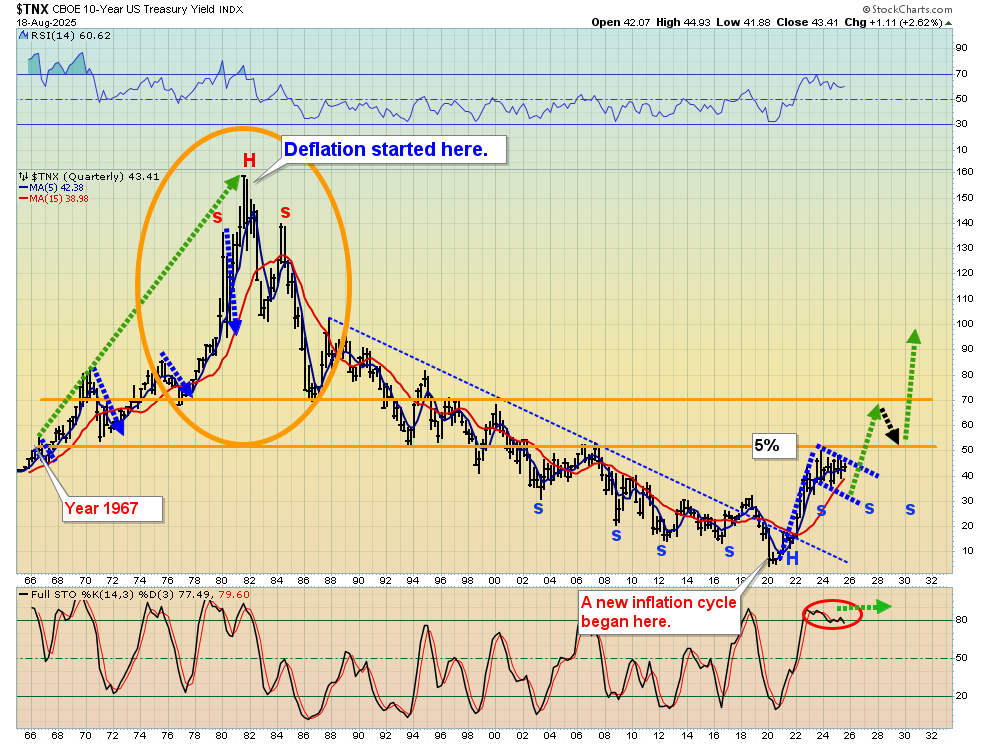
US rates and inflation cycle chart
American deflation/inflation cycles tend to last 40 years and the current one is an inflation cycle… with 35 years to go.
In a nutshell, gold stocks are likely to be in an overall bullish posture until the year 2060. Both the US fear trade for gold (government debt) and the Asian love trade (celebration of economic growth) will be factors throughout the cycle.
(Click on image to enlarge)
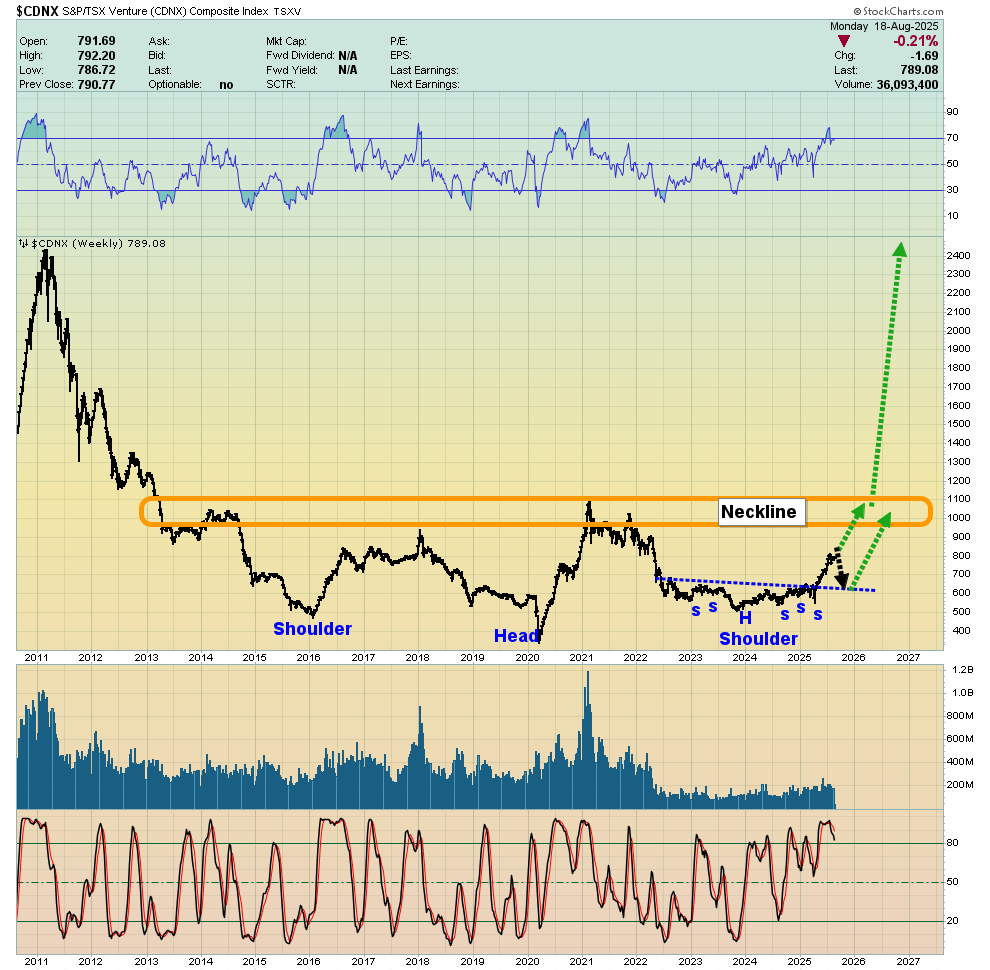
Here’s another chart that belongs in the history books as one of the greatest of all time.Junior mining stock ten baggers will likely be the norm as the “gold bull era” intensifies.
Next,
(Click on image to enlarge)
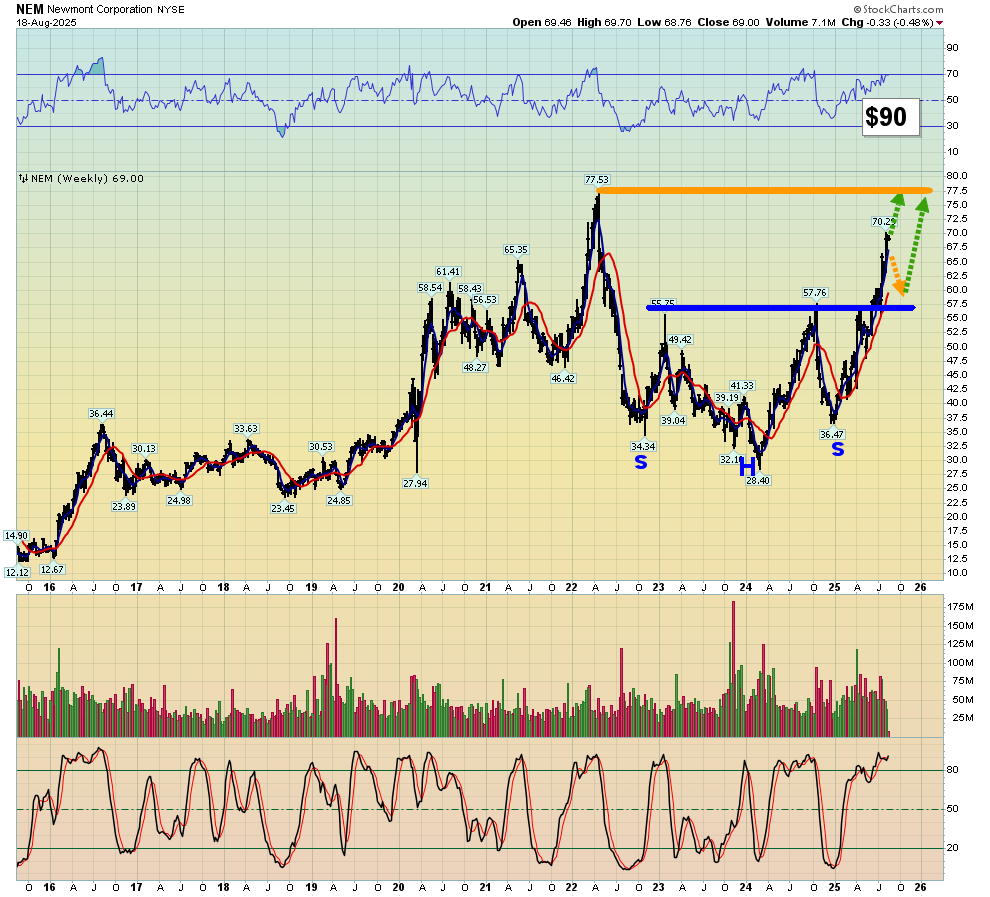
weekly Newmont chart
The inverse H&S pattern target is about 90.Given its size, a move to the key round number of 100 is likely.
Gold stock investors need to adapt to the reality of this inflation cycle; in the past, most gold stock rallies were followed by huge declines.That’s not so likely to occur in this cycle.
For a look at the NEM daily chart,
(Click on image to enlarge)
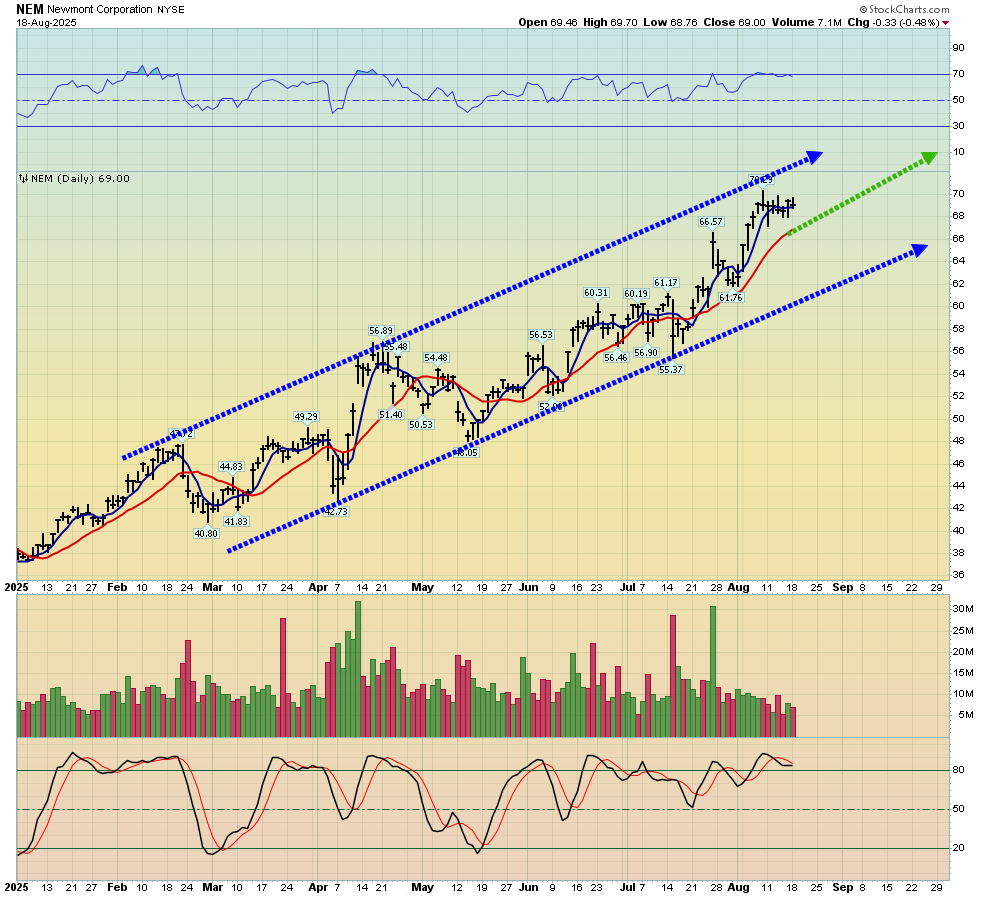
NEM looks like a “Golden Freight Train” and the only question is, are all senior mining stock enthusiasts onboard?
Lastly, to view the most important NEM chart of them all,
(Click on image to enlarge)
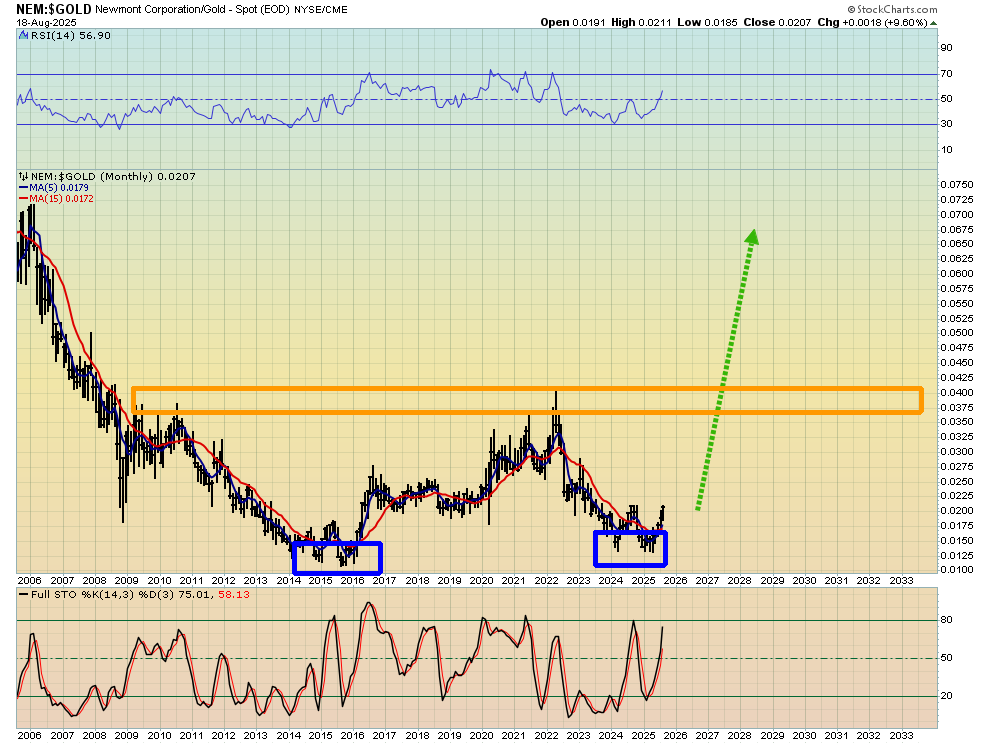
long-term NEM versus gold chart
In a deflation cycle, rates fall, and money managers buy some gold but most of their focus is on the stock market.In an inflation cycle, rates rise, and they sell the stock market and buy the miners. Newmont and other major miners could be at the start of a glorious bull run that continues until the year 2060!
More By This Author:
White Metals: The New Performance HavenGDX The Word's Most Aesthetic Chart
Juniors Miners Set To Outperform Everything


Comments
Log in or sign up to join the conversation.