
Gold Steady Near 4,200 USD As Markets Await Key Data

Image Source: Pexels
Gold prices held close to 4,200 USD per ounce on Friday, with investors focused on a significant, delayed inflation report ahead of next week’s Federal Reserve policy decision.
All attention is on the release of the September Personal Consumption Expenditures (PCE) index, the Fed’s preferred inflation gauge. The data could be decisive in shaping expectations for the timing and scale of upcoming monetary easing.
Earlier in the week, further signs of a cooling labour market emerged. ADP reported an unexpected decline of 32,000 in private sector payrolls, while the Challenger report recorded 71,000 layoffs in November – bringing the year-to-date total to nearly 1.17 million.
This combination of soft employment figures has reinforced investor conviction that the Fed will cut rates as early as next week, with the market-implied probability now standing at approximately 87%.
Adding to the dovish narrative are reports that White House economic adviser Kevin Hassett may succeed Jerome Powell as Fed Chair in May. Markets interpret this as a potential tilt towards more aggressive policy easing.
Despite a moderately lower weekly close, gold remains well-supported heading into the critical data release.
Technical Analysis: XAU/USD
H4 Chart:
(Click on image to enlarge)
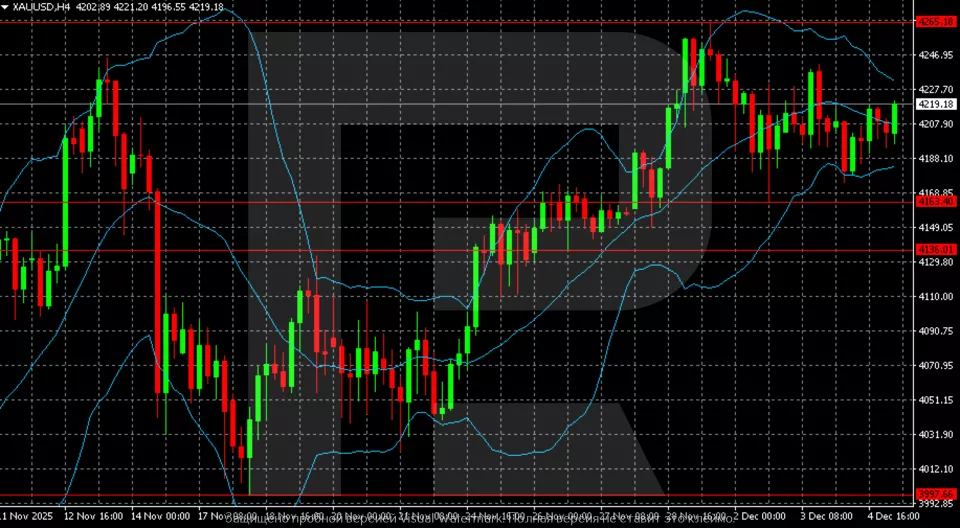
On the H4 chart, gold (XAU/USD) is consolidating after its recent advance toward 4,220–4,230 USD. The price remains above the middle Bollinger Band, with the upper band turning slightly upward, suggesting an attempt to recover from recent weakness.
Key resistance is around 4,265 USD, a level the market has repeatedly tested without securing a decisive breakout. A sustained move above this level would clear the path towards 4,300 USD and beyond.
Immediate support is marked at 4,163 USD. A break below this level would increase selling pressure and raise the risk of a decline towards the next demand zone near 4,136 USD. A close below 4,136 USD would signal a transition into a deeper corrective phase.
H1 Chart:
(Click on image to enlarge)
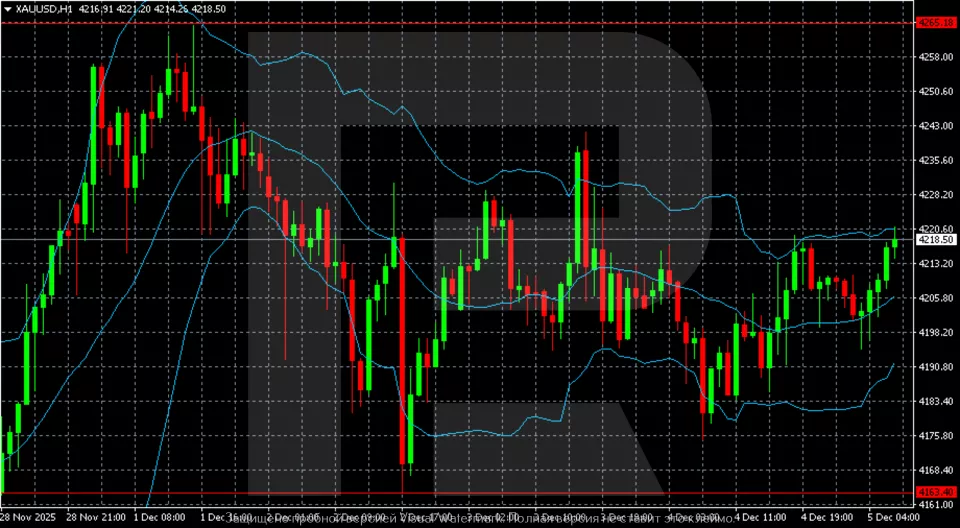
On the H1 chart, XAU/USD is trading within a tightening range between 4,188 USD and 4,220 USD, reflecting mixed short-term momentum. The middle Bollinger Band is providing near-term equilibrium, confirming the absence of a clear directional bias.
The upper Bollinger Band is capping advances near 4,220–4,225 USD, with several rejections from this zone indicating local overbought conditions. The lower band is offering support around 4,185–4,190 USD.
A sustained move above 4,220 USD would signal a resumption of bullish momentum, initially targeting 4,235–4,240 USD, and potentially 4,265 USD. Conversely, a break below 4,185 USD would open the way towards 4,163 USD. A loss of this support could intensify corrective pressure and expose the 4,136 USD level.
Conclusion
Gold remains in a holding pattern near 4,200 USD as traders await the delayed PCE inflation report. While labour market softness has bolstered expectations for Fed easing, the technical picture reflects consolidation within a defined range. A decisive reaction to today’s data is likely to set the tone ahead of next week’s FOMC meeting, with a break above 4,265 USD opening the door to further gains, while a drop below 4,163 USD risks a deeper correction.
More By This Author:
GBP/USD Extends Gains As Interest Rate Divergence Captures Focus
USD/JPY Declines As Market Focus Shifts To Bank Of Japan Policy
EUR/USD Holds Ground Amid Firm Focus On Fed Policy
Disclaimer: Any forecasts contained herein are based on the author's particular opinion. This analysis may not be treated as trading advice. RoboForex bears no responsibility for ...
more

