

Gold prices finished last week’s weekly bar as a doji, and that makes two consecutive weeks in which that’s happened. A doji in and of itself is indecision and two consecutive dojis is, you guessed it, more indecision. It does take on a bit more interest when looking at the prevailing trend, however, as a strong breakout in November has started to hit turbulence around a prior spot of resistance, taken from the August highs around the 1819-1824 area on the chart.
Gold Weekly Price Chart
(Click on image to enlarge)
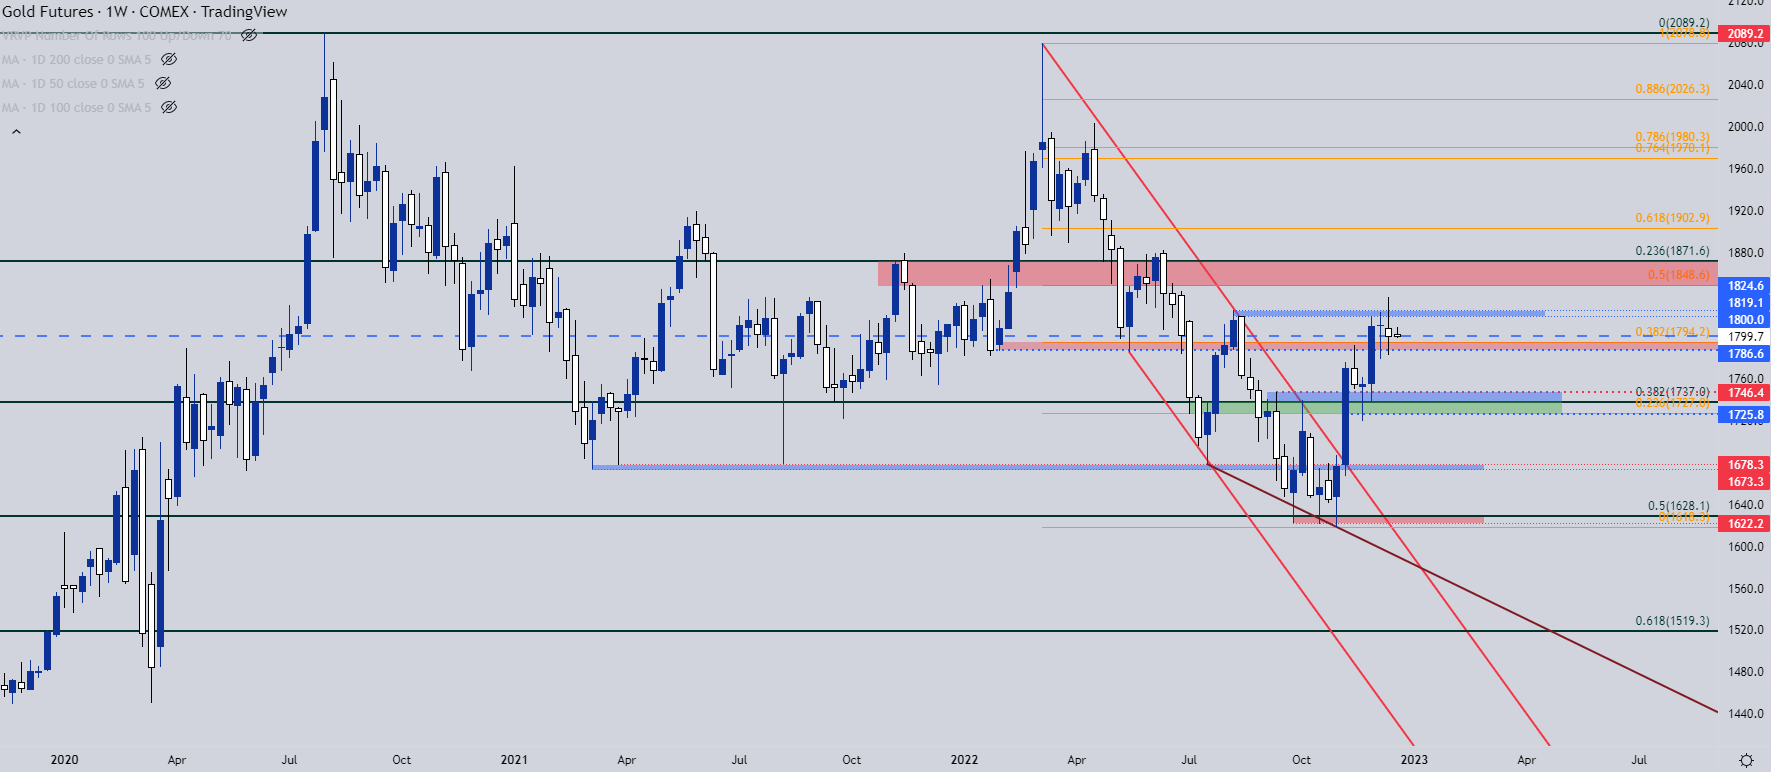
Chart prepared by James Stanley; Gold on Tradingview
From the daily chart below we can get greater gradience to the matter following last week’s failed breakout at 1824. That took place on Tuesday and prices held in that resistance zone on Wednesday, through the FOMC rate decision. Thursday, however, saw a lower-low print with at test at the bottom of support around 1786. The Friday bounce saw prices re-engage with the 1800 psychological level and to start this week, bulls have attempted to push price back-above.
Gold Daily Chart
(Click on image to enlarge)
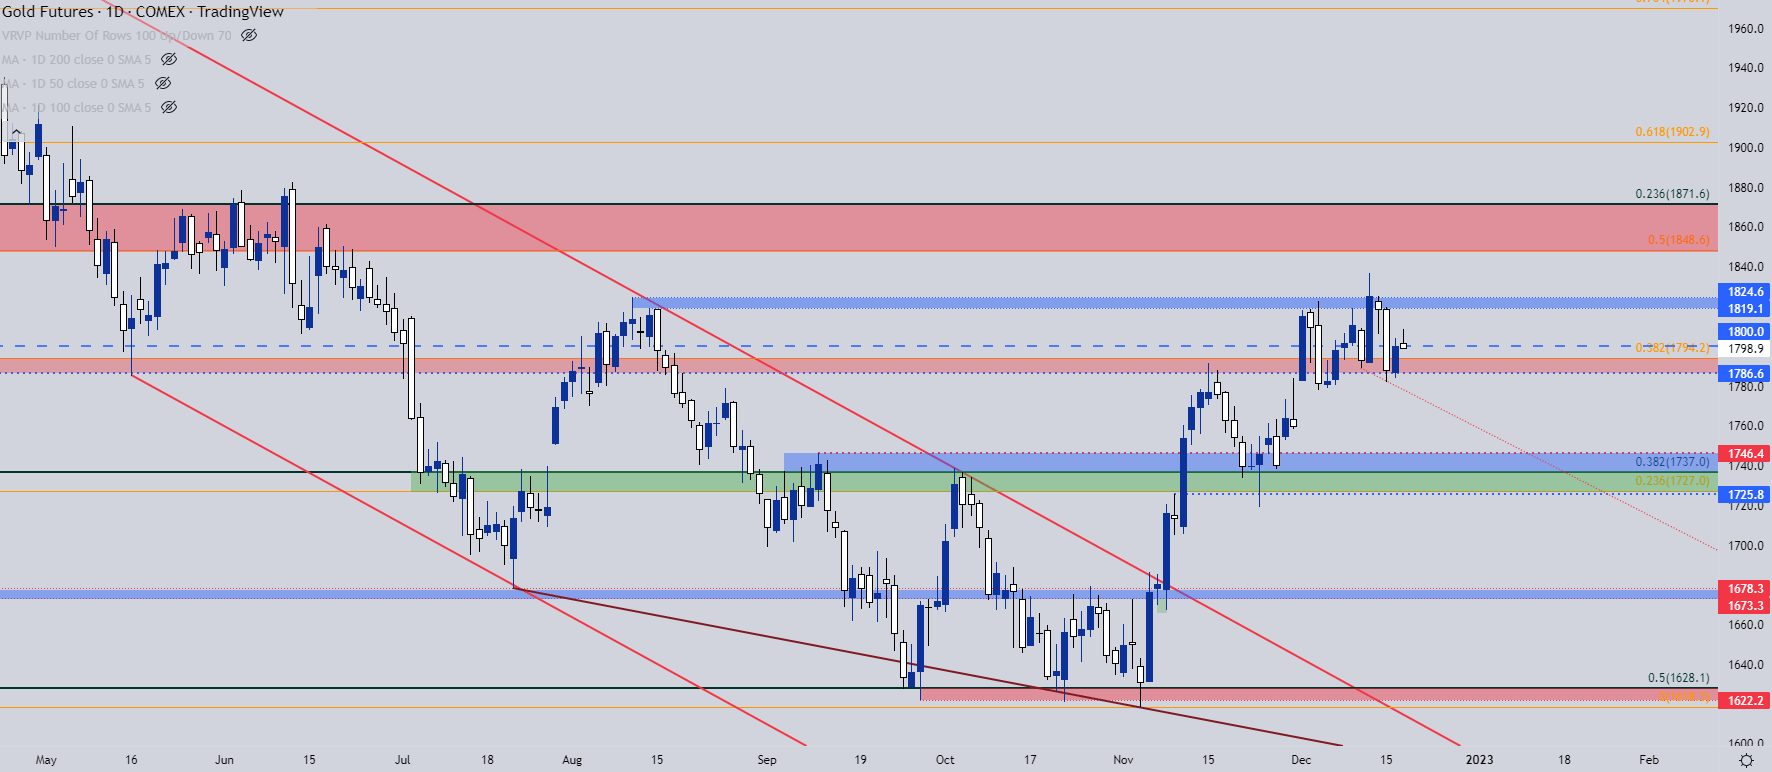
Chart prepared by James Stanley; Gold on Tradingview
GOLD SHORT-TERM
Going down to the two hour chart to focus on the recent support bounce, and we have a case for fresh higher-highs and lows on a short-term basis. For those with a longer-term point of view, looking for manners of establishing bearish exposure, a push back below 1794 could be seen as a failure from bulls that re-opens the door for a test at the bottom of support, from around 1786.
But, if bulls can hold 1800 through the end of the day, there’s remaining potential for another test of the 1819-1824 zone of resistance sitting overhead.
Gold Two-Hour Price Chart
(Click on image to enlarge)
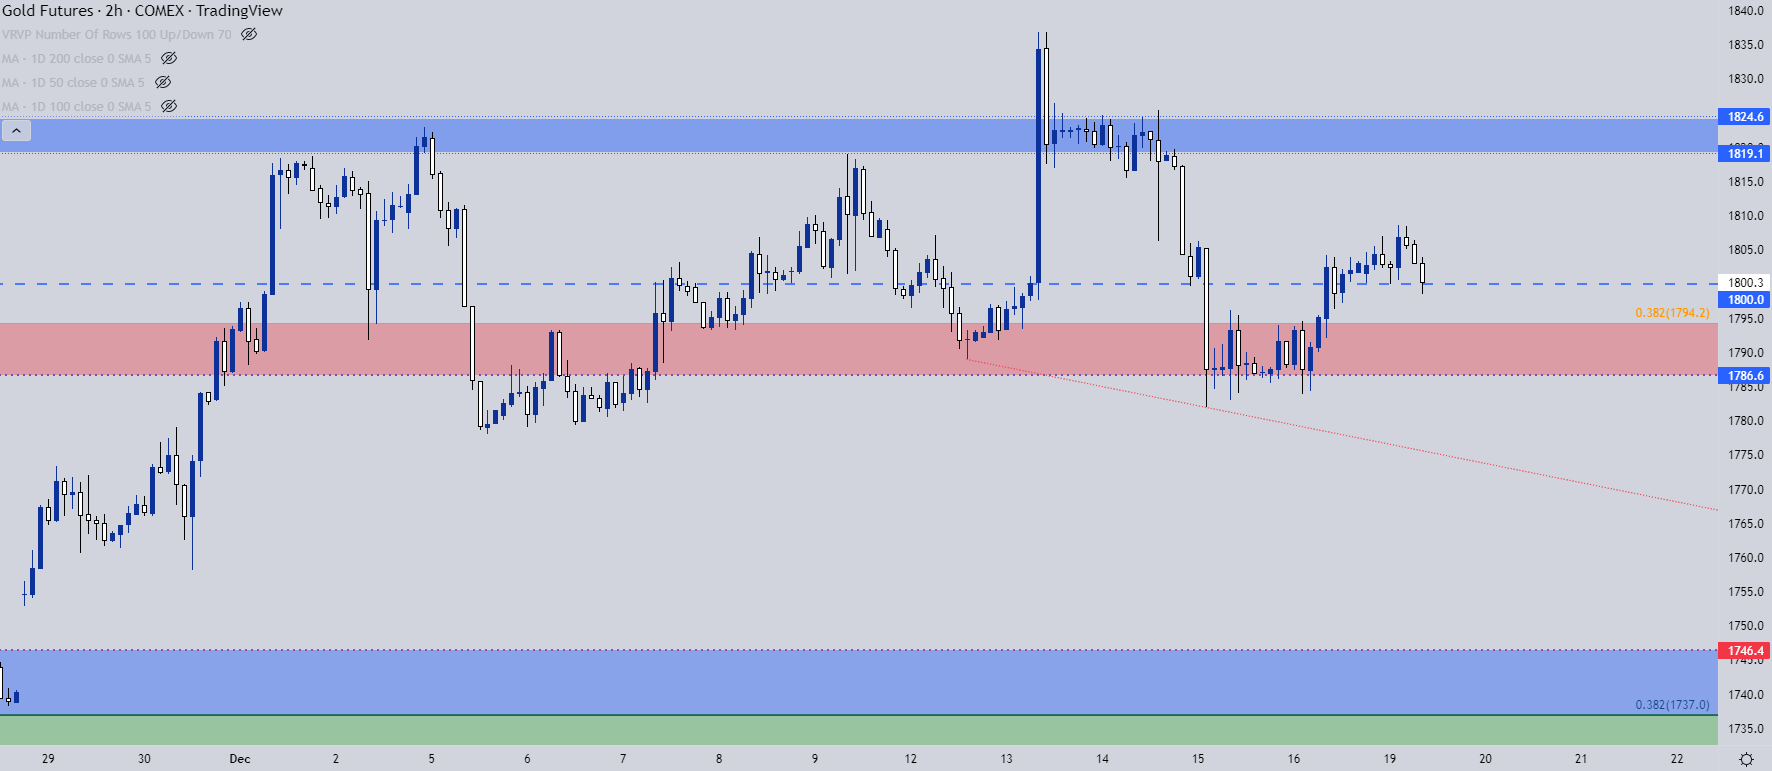
Chart prepared by James Stanley; Gold on Tradingview
SILVER
Silver prices have been on a tear since the November low, at many points outstripping the bullish behavior in Gold. Last week saw a fresh seven-month-high print for Silver prices, with price action pulling back on Thursday, eventually finding support on Friday at a key zone around the $23 handle.
That support bounce has led to a re-test of Fibonacci resistance at 23.64 which, so far this week, has held the highs. But, this puts bulls in a spot to look for a higher-low, plotted around that same zone that runs from around $23 up to $23.14. The Friday support hit was not clean, so I wouldn’t expect a follow-through test to be either, but if price can hold a higher-low today above that Friday swing at $22.73, the door can remain open for a re-test of Fibonacci resistance at 23.65 after which another Fibonacci level appears at 23.88.
Silver Daily Price Chart
(Click on image to enlarge)
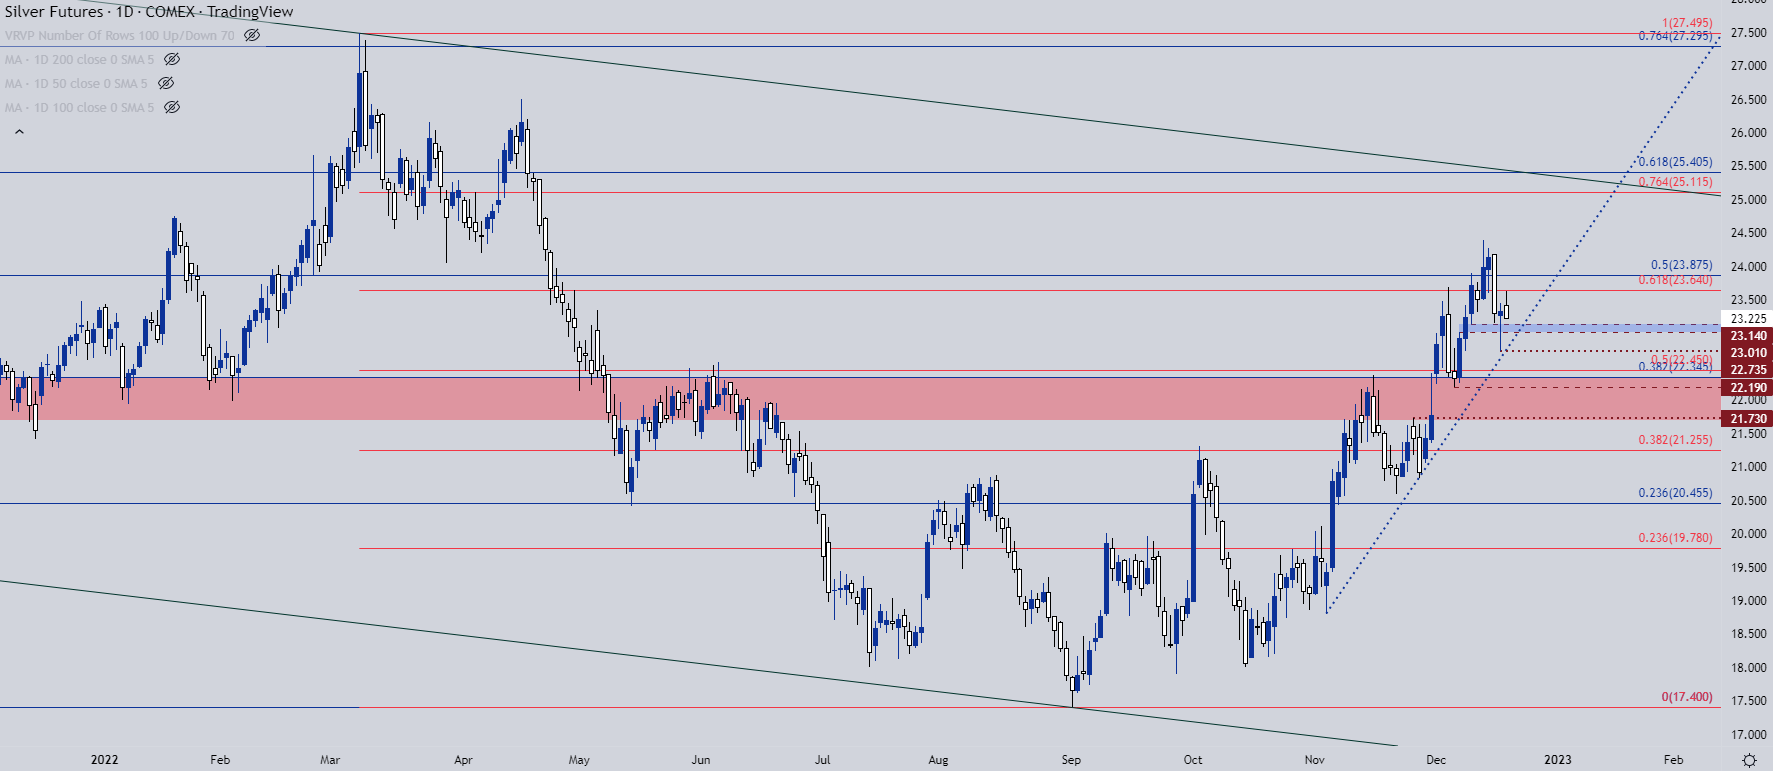
Chart prepared by James Stanley; Silver on Tradingview
More By This Author:
S&P 500, Nasdaq, Dow Jones Forecast For The Week Ahead
SPX, Nasdaq Slide; USD, EUR/USD Tendencies Of Turn After CB Onslaught
Crude Oil Technical Analysis: Oil Bounces From Fibonacci Support


Comments
Log in or sign up to join the conversation.