Gold: Resistance Is...Finite

Image Source: Pixabay
The human mind likes big round numbers. Which is why, when a tradable asset is rising, sell orders tend to cluster in predictable spots. The frequent result is a repeating pattern of strong gains running into waves of selling that knock the price back down. Traders refer to this as “resistance,” and it’s maddening for long-and-strong investors who just want their stock or commodity to go straight up.
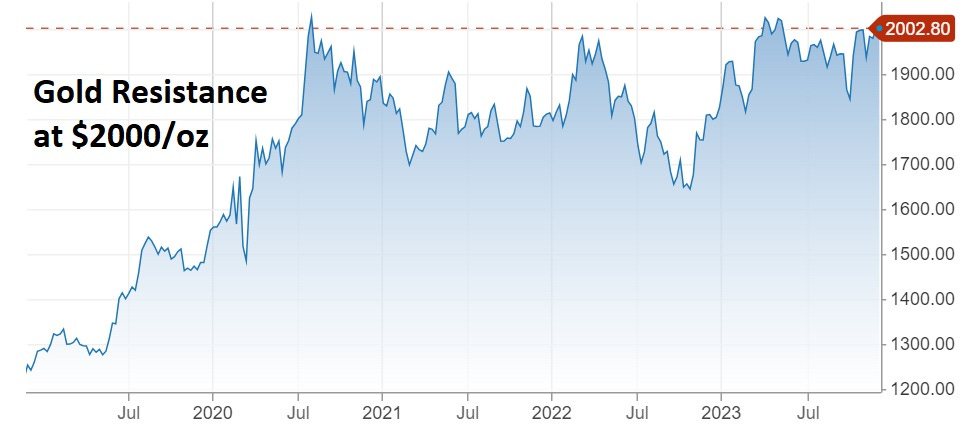
Today’s gold chart is a classic example.
Since July 2020, gold has repeatedly threatened $2000/oz, only to be smacked back down by all who bought at $1000 and see $2000 as a psychologically comforting place to take profits.
(Click on image to enlarge)

Resistance is finite
Selling interest at a given price is not unlimited. So one way that this might resolve is for gold to keep threatening $2000 until the number of sellers diminishes to irrelevance. It will then be free to rise with little new resistance until the next big round number — say $2500.
How close is gold to penetrating resistance? Well, $2000 has held for 3+ years, which means a lot (most?) of the potential selling has already happened.
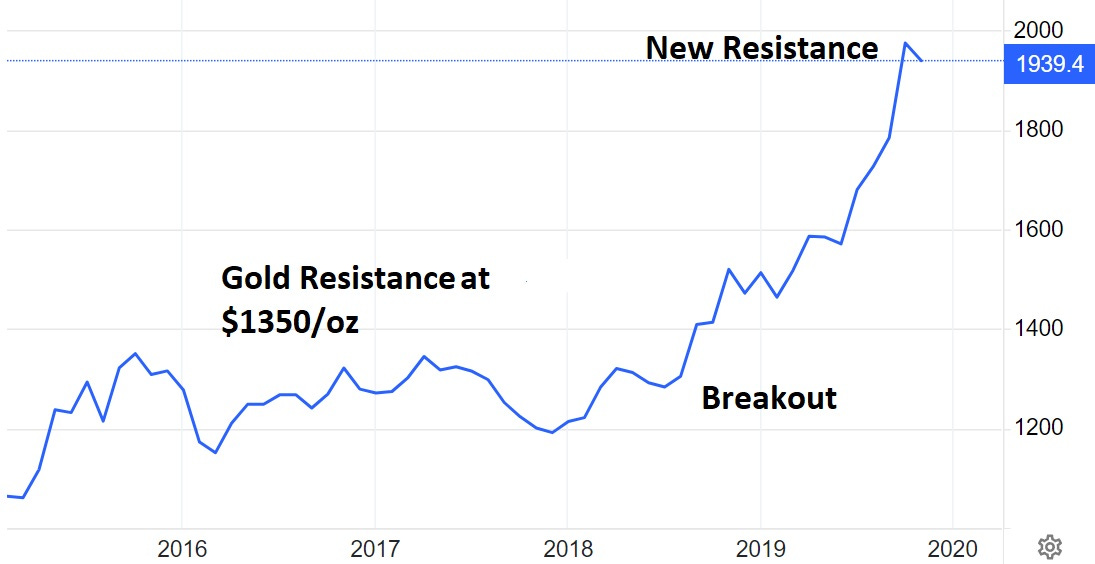
For a sense of how this might look, check out gold’s last resistance battle. Between 2015 and 2019 its price bounced off ~ $1350 four times until gold bugs began to wonder if $1400 was forever out of reach. But the same repetition that demoralized the longs eventually exhausted the sellers, and when gold finally pierced $1350 it was off to the races until 2020, when it hit the current $2000 resistance.
(Click on image to enlarge)

There’s no guarantee that this pattern will repeat. But both recent history and human psychology say it’s definitely possible.
More By This Author:
Recession Watch: Wow, That Was Fast
Uranium Stocks: What Just Happened To SMRs?
Are There Too Many People Or Too Few?


