
This week, we will look at how two gold ratio charts are telegraphing a secular bull market that has a great deal of fuel left in the tank and in fact may just be getting started. The first chart is that of the long-term Gold/Silver ratio, which I have defined as a 65-year ascending triangle. Generally, a falling ratio is good for metals prices and a rising ratio is a headwind — the correlation isn't perfect, but it is quite useful when values move to extremes like it did in 2020 to mark the silver bear market low.
(Click on image to enlarge)
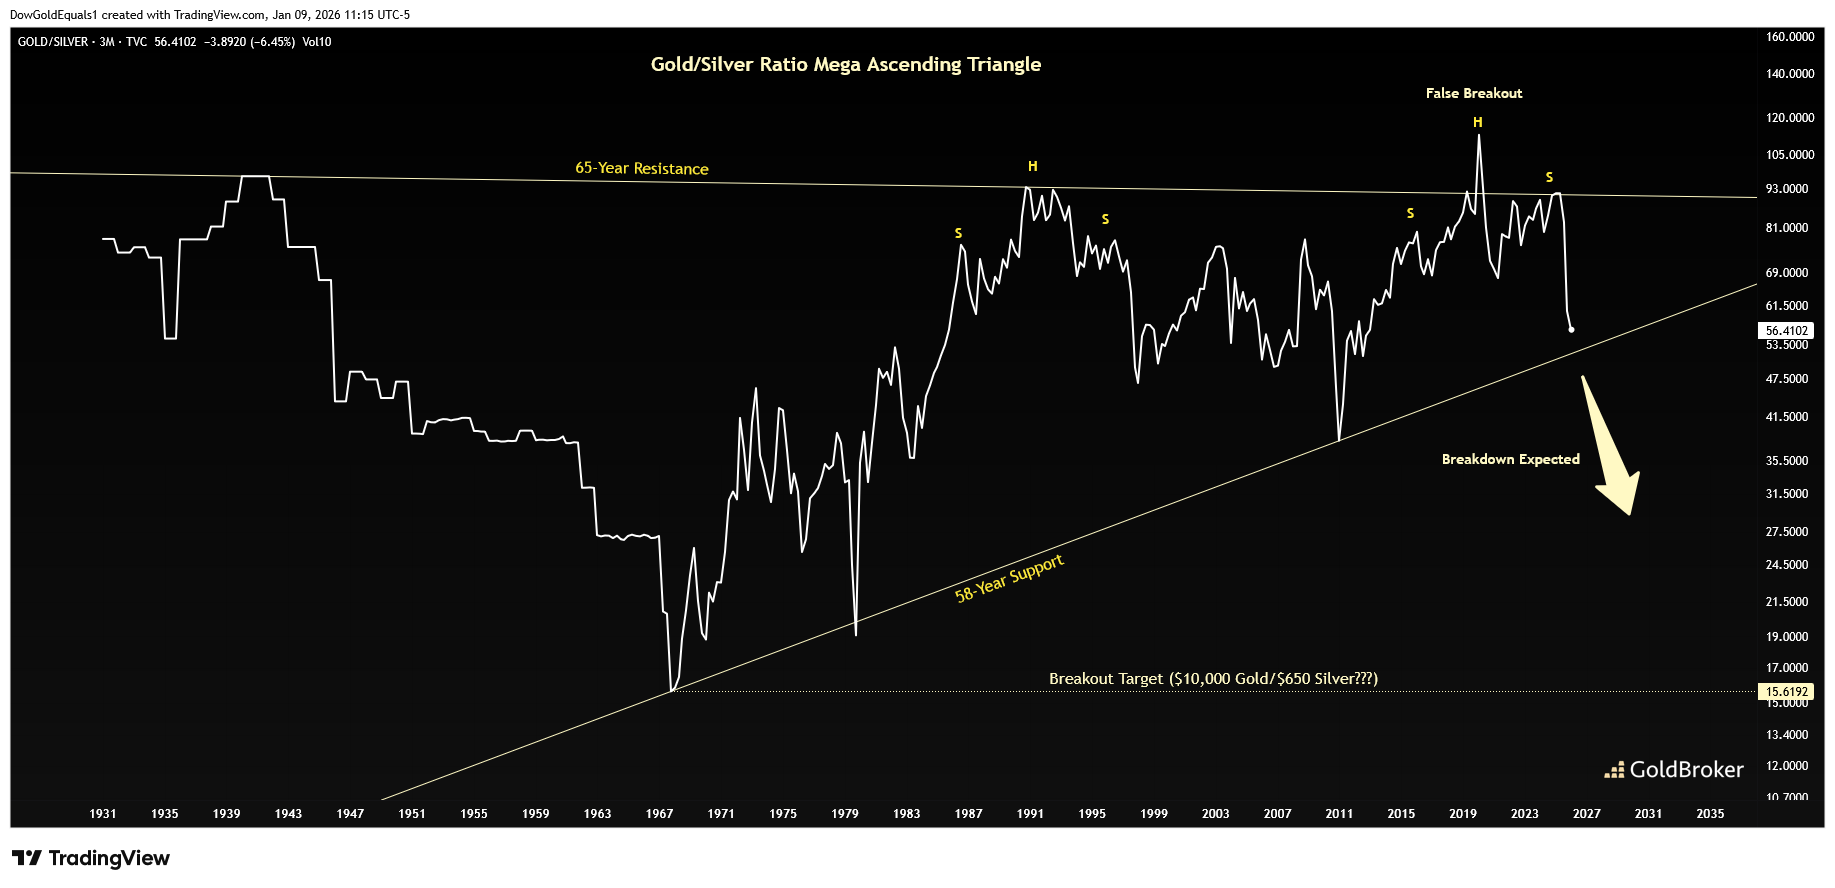
I've discussed before that various wedge and triangle formations are not inherently bullish or bearish but must be watched to see how they breakout. Sometimes we are lucky and get a false breakout as an advanced warning. I believe that's what we have here, with the false breakout in 2020 signaling that this rising triangle will resolve bearishly. We will watch the ratio closely as it approaches the lower rail, 58-year support, for a potential breakdown. Should it do so, the measured move impulse would take the ratio to the 15-area, and such a move would very likely propel metals prices much, much higher with silver outperforming gold significantly. My long-standing targets of $10,000 for the gold price and $650 for the silver price are noted.
(Click on image to enlarge)
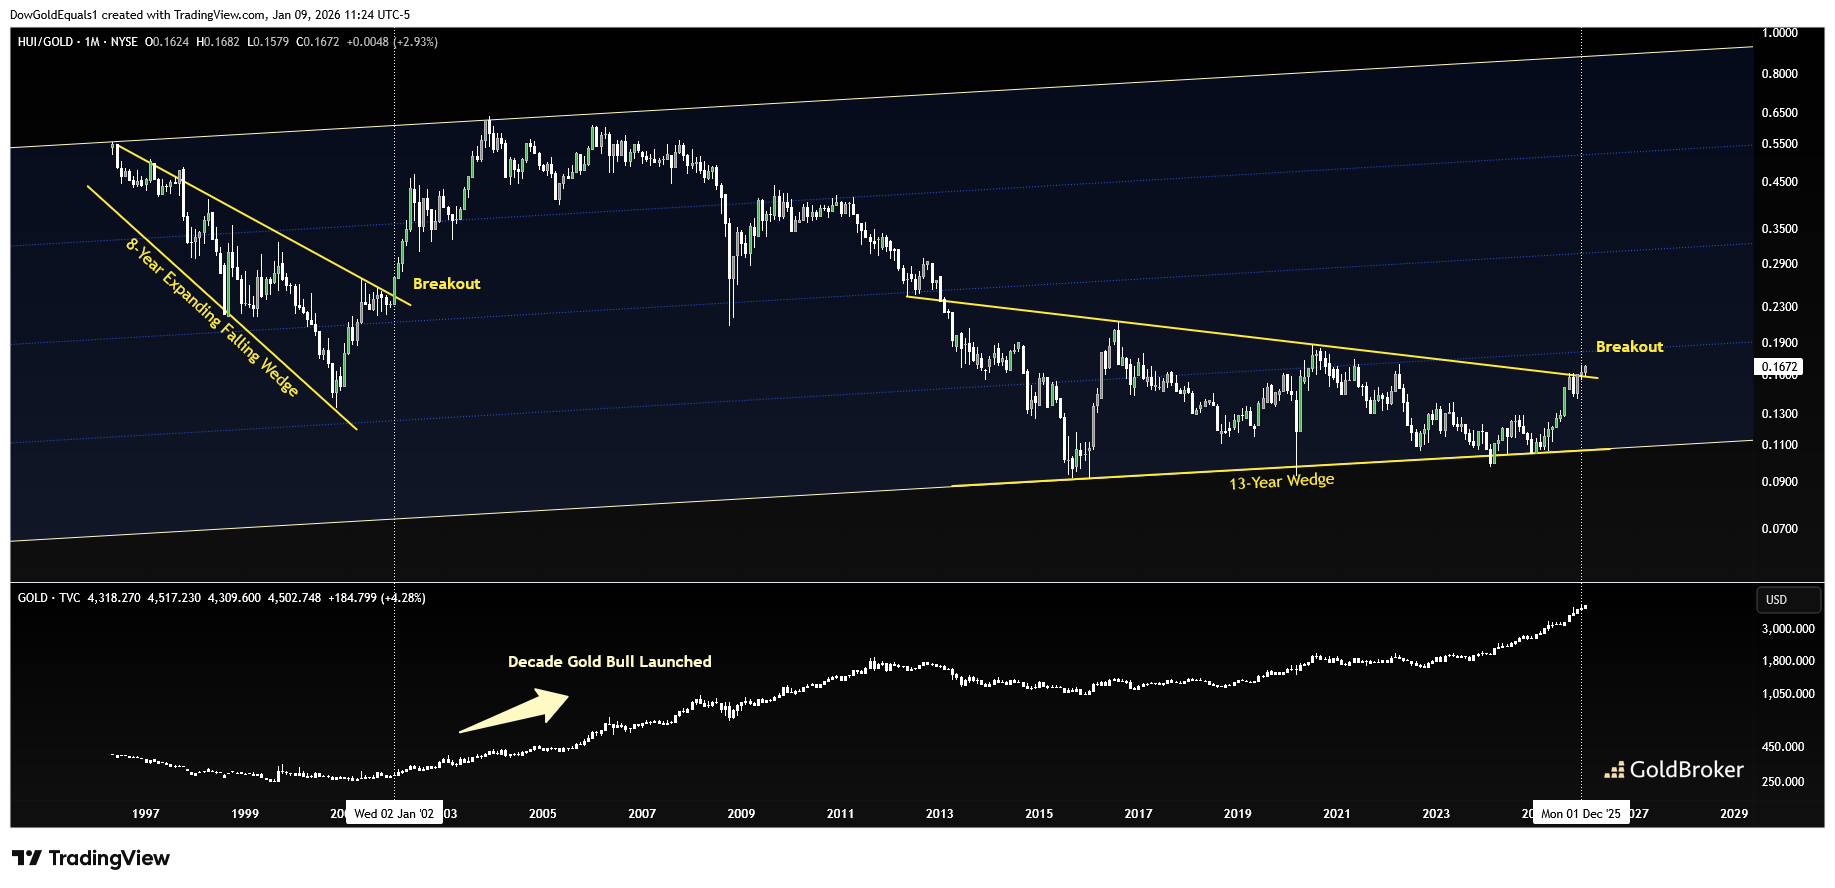
The second chart is one I've shown you before but is worth an update as price is now at a significant inflection, and that is a ratio of gold miners (HUI) to gold. Gold miners have always been very good at sniffing out a gold bull market, and they generally outperform initially when the gold bull gets going. Here, we can see that when the ratio broke out of an 8-year bullish falling expanding wedge, a decade-plus gold bull commenced. Price is once again breaking out of a large consolidation pattern, this time a bigger 13-year wedge. From this perspective, the miners seem to believe that the move in gold is just getting started and that we might be in store for something truly special.
There is a lot of excitement out there about $4,500 gold and $80 silver, but as I have said for years, we should be looking for much, much higher prices.
More By This Author:
Finance Celebrates 2025, But Gold Is Already Pricing In 2026A Yuan Pegged To Gold In 2026?
Outlook 2026: Silver, The Return Of A Strategic Metal


Comments
Log in or sign up to join the conversation.