
Gold prices are on a wild ride this year, with the yellow metal down sharply from its 2022 peak in March when prices breached the 2,000 level. Prices are down around 20% since then and are trading almost unchanged on the day in Asia-Pacific trading. It has been a disappointing year for gold bugs, especially amid persistent inflation that boosted its bull case in the eyes of many. But a stronger-than-expected resolve in the Federal Reserve's inflation fight tempered the trade.
The Federal Reserve remains adamant in its messaging: it will stop at nothing to achieve price stability. Despite failed attempts by investors to judge the turnaround point, market bets for the FOMC’s rate hikes appear maxed out. That and what looks like an impending era of a structurally higher inflationary environment is setting the stage for a price rally.
While much uncertainty remains, some notable signs in the market suggest XAU has put in its bottom. For instance, the correlation between nominal Treasury yields and gold prices. The policy-sensitive 2-year rate is trading around 4.314%, putting it below the 4.314% high made in September when gold prices hit a multi-year low at 1,614.92, but just barely. Despite the 2-year yield rising near that September high, gold prices remain near the 1,633 level, which is around 3% higher than the September low.
That signals an improvement in bullion sentiment. Moreover, if government bond yield appetite returns and markets believe the Fed’s rate hiking cycle is near its peak, yields would fall. Gold, a non-interest-bearing asset, would be facing a much-improved backdrop. The yellow metal looks poised to shine again.
Gold Versus 2-Year Treasury Yield – Daily Chart
(Click on image to enlarge)
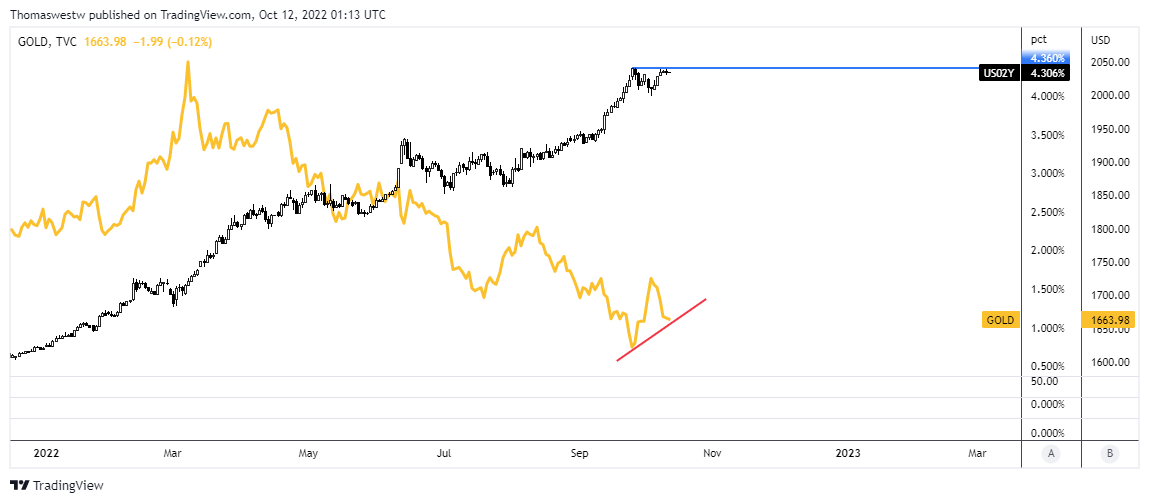
Chart created with TradingView
Speculators have already started to position themselves for this trade. Per the latest Commitments of Traders (COT) from the CFTC, gold speculators added 17,145 long contracts while exiting 27,3030 short contracts, which brought the net long position to around 90k. While that is only the highest net long since early September, it’s a positive sign. Earlier traders are the ones who sow the greatest returns.
Gold Overlaid Against COT Long/Short Speculators (COT) – Daily Chart
(Click on image to enlarge)
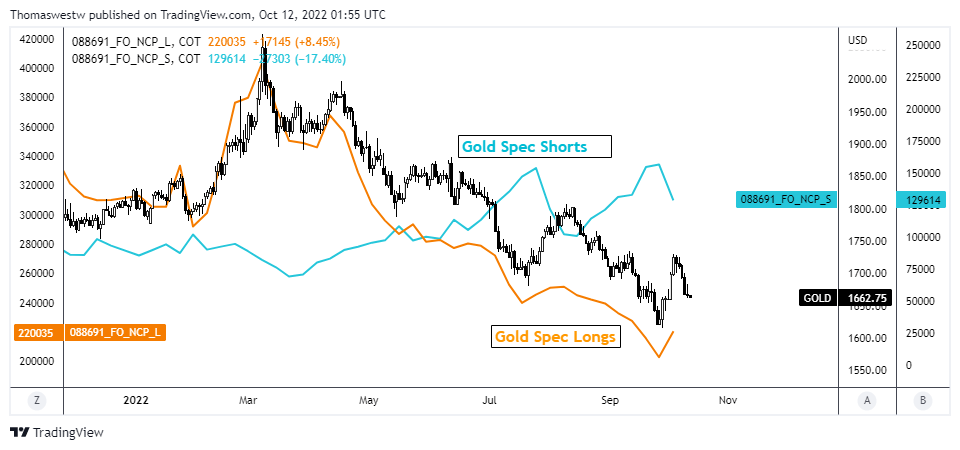
Chart created with TradingView
More By This Author:
Bitcoin Technical Outlook: BTC/USD Breaches 19,000 – June Low LoomsNasdaq 100, S&P 500 And Dow Under Pressure Amid Fragile Sentiment
S&P 500 Extends Slide As Traders Eye Economic Data, Bank Earnings


Comments
Log in or sign up to join the conversation.