
Gold Prices Fail To Capitalize On Market Rout, But US Dollar Does
Traders looking for gold prices to reflect the yellow metal’s often-touted haven credentials were disappointed Friday. It fell even as the bellwether S&P 500 stock index hit a 17-month low as investors flocked to the US Dollar for safe harbor, undercutting the appeal of anti-fiat alternatives.
The Greenback’s appeal was not tarnished by a partial shutdown of the US government at the heart of the selloff or a further flattening of the priced-in 2019 rate hike path implied in Fed Funds futures. That echoes its shining performance amid the 2008 meltdown when its unrivaled liquidity overshadowed all else.
Sentiment-linked crude oil prices fell alongside shares, though the drop was a bit more contained. Beyond familiar concerns about growth and oversupply, the move lower was amplified as assets denominated in USD terms on global markets faced de-facto selling pressure courtesy of the benchmark unit’s rally.
DRAMA IN WASHINGTON, DC EYED IN QUIET HOLIDAY TRADE
Looking ahead, significant directional progression seems unlikely as liquidity evaporates ahead of Christmas holiday closures in most of the world’s leading financial centers. Still, traders would be wise to keep an eye on news-flow as the situation in Washington DC remains in flux.
A dispute over funding for a wall along the southern US border – favored President Trump and staunchly opposed by the Democrats – derailed a stopgap bill that would have averted a government shutdown Friday. Incoming White House Chief of Staff Mick Mulvaney signaled it may continue into 2019.
Meanwhile, an attempt at calming jittery markets by Treasury Secretary Mnuchin may have backfired. He rushed to assure markets that they were amply supplied with liquidity after the recent bloodletting. That sparked concern from traders wondering why – and if – they should be worried about credit conditions.
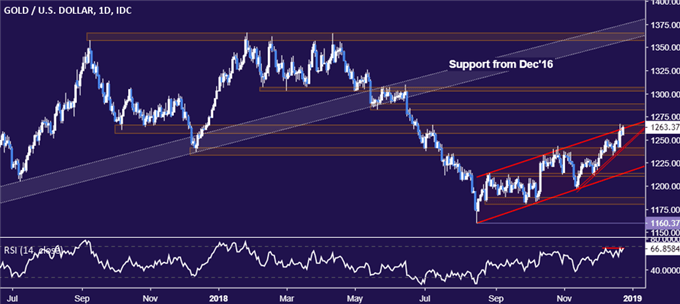
GOLD TECHNICAL ANALYSIS
Gold prices are testing resistance in the 1257.60-66.44 zone, with a daily close above that exposing the 1282.27-88.85 area. Negative RSI divergence hints a turn lower may be in the cards, however. A turn below the 1233.60-41.80 region targets a channel support at 1211.05.
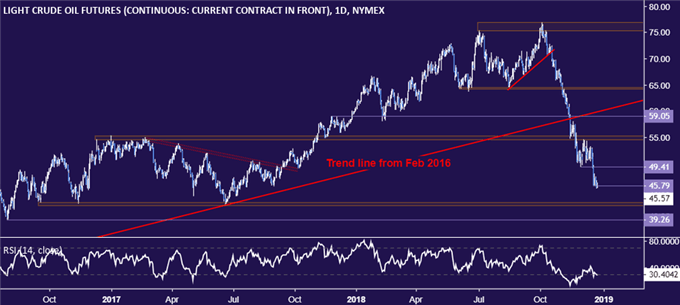
CRUDE OIL TECHNICAL ANALYSIS
Crude oil prices edged past the December 18 low at 45.79, exposing the next downside barrier in the 42.05-55 area. A move further beyond that targets 39.26. Alternatively, a bounce back above the 45.79 and the November 29 low at 49.41 opens the door for a retest of the 54.51-55.24 zone.
Disclosure: Do you want to see how retail traders are currently trading the US Dollar? Check out our IG Client Sentiment ...
more

