Gold Price To Monetary Base – A Ratio To Keep An Eye On
“The monetary base is the total amount of a currency in circulation or held in reserves. Money in circulation is anything that is held and used by the general public while reserves refer to commercial bank deposits and any money held in reserves by these institutions at the central bank.” Investopedia
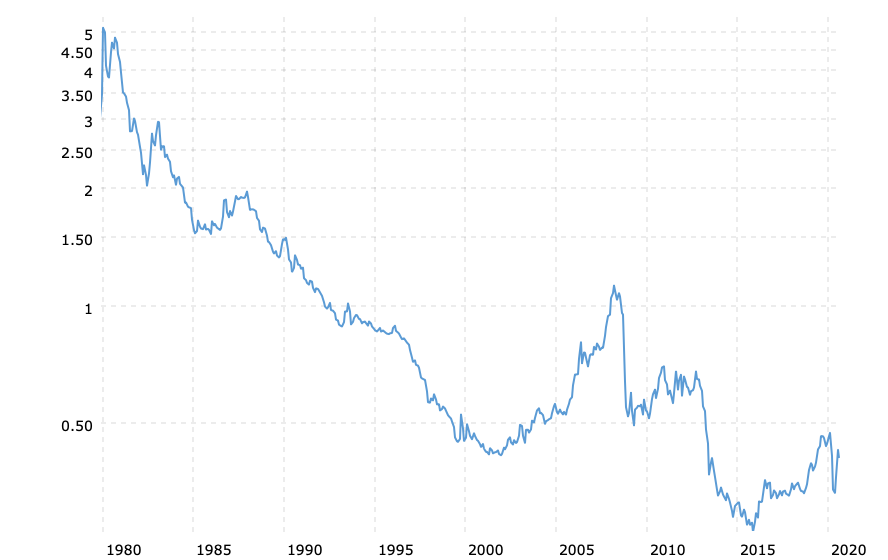
The chart below shows the ratio of the gold price to the St. Louis FED Adjusted Monetary Base beginning in 1980 and continuing until August 2020…
Gold to Monetary Base Ratio 1980-2020
(Click on image to enlarge)

As can be seen, the ratio has shrunk from 5 to less than .5 over that four-decade span.
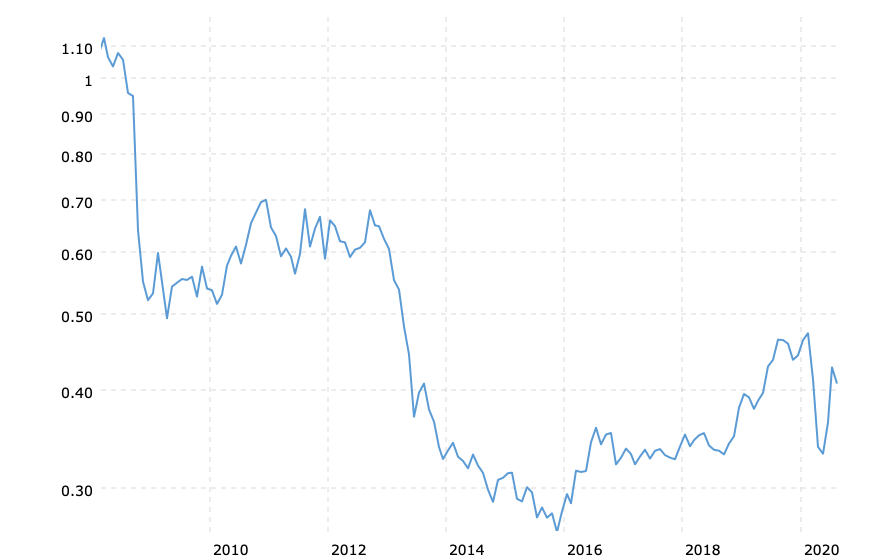
Below is a second chart which highlights the period beginning in 2008 (see spike in the ratio in the chart above) and continuing again until August 2020…
Gold to Monetary Base Ratio 2008-2020
(Click on image to enlarge)

After 2008, the ratio declined dramatically until the end of 2015, when it reached a low of .26. After a doubling of the gold price between 2016-20, to a gold price that was more than three times higher than its peak in 1980, the ratio was sitting at .41, nearly ninety-two percent lower than in 1980.
It is apparent that since the culmination of the original catch up period 1971-80, the gold price continues to reflect less and less of the effects of more and more inflation.
FED BALANCE SHEET VS GOLD PRICE
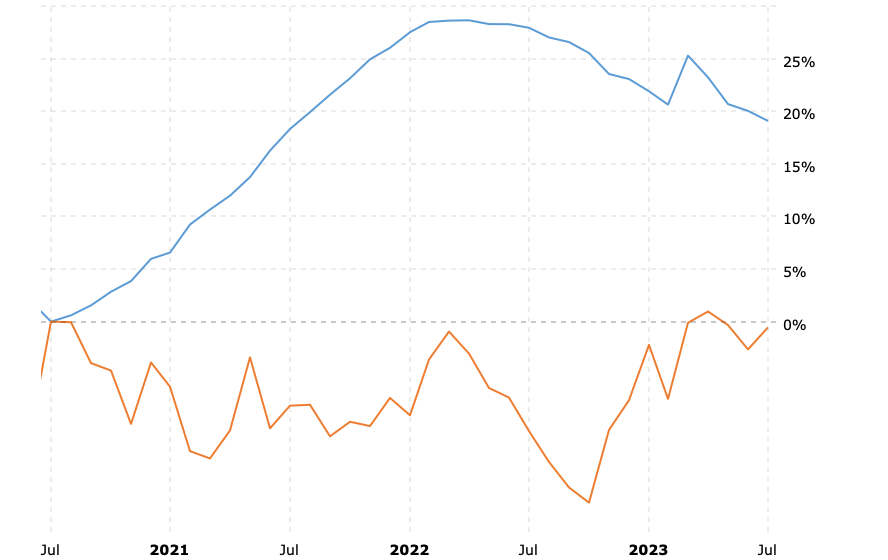
The monetary base roughly matches the size of the Federal Reserve balance sheet. The chart below shows the growth in size of the Federal Reserve balance sheet versus the gold price since 2020…
Fed Balance Sheet vs Gold Price 2020-2023
(Click on image to enlarge)

This chart compares the monthly percentage growth of the Federal Reserve balance sheet (U.S. Treasuries and Agency MBS) against the price of gold back to 2020.
Since 2020, the trend towards a lower ratio of gold to the monetary base has continued and accelerated.
The price of gold is at or near its same price from 2020, while the size of the Federal Reserve balance sheet has increased by twenty percent.
TAKEAWAYS AND CAVEATS
Why does the ratio of the gold price to the monetary base (total amount of money in circulation or held in reserves) continue to decline? Shouldn’t it go higher over time; or at least remain stable?
While it seems logical to expect a stable to higher gold-to-monetary base ratio, the expectation is based on the assumption that the higher price of gold is a reflection of the increase in the monetary base.
That is not the case. The price of gold reflects the actual loss of purchasing power in the U.S. dollar that has already occurred.
The loss of purchasing power in the U.S. dollar is a result of the cheapening of all the money in circulation due to the continual expansion of the supply of money and credit; i.e., the monetary base.
Also, it is important to know that the extent of any loss of purchasing power in the dollar is not proportionate to the size of any increase in the monetary base and is unpredictable.
SUMMARY
Another reason that might impact the continued decline in the gold to monetary base ratio is that inflation created by the Fed is losing its intended effect.
With all of the trillions of dollars of credit that were created by the Fed in response to the events of 2007-08, why did things not get better more quickly and more obviously?
Further, why should we expect better results this time around from a Federal Reserve that has pretty much lost control of a sinking ship?
More By This Author:
Gold Vs. Stocks And Interest Rates – No Correlation
The Federal Reserve And $10,000 Gold
Will The U.S. Dollar Collapse?


