
Gold Price Targets: XAU/USD Threatens Breakout- GLD Outlook
Gold prices are on the counter-offensive mid-week with the precious metal poised to mark a third consecutive daily advance. The recent gains take price into near-term resistance however and leave the immediate rally vulnerable heading into this key threshold. These are the updated targets and invalidation levels that matter on the XAU/USD charts this week.
GOLD PRICE CHART - XAU/USD DAILY
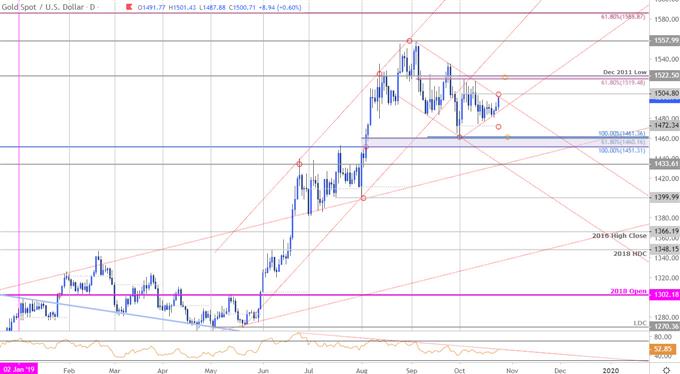
Chart Prepared by Michael Boutros, Technical Strategist; Gold on Tradingview
Technical Outlook: In my latest Gold Price Outlook we noted, “the risk for a deeper pullback while below 1522/26. Form a trading standpoint, be on the lookout for a breakout of the monthly consolidation/topside exhaustion ahead of the monthly high-day close at 1505on rebounds IF price is indeed heading lower.” Price registered a low this week at 1480 before rebounding off slope support with the subsequent rally testing this resistance zone today – note that the September trendline now converges on this region as well and further highlights its technical significance- looking for a reaction here.
A topside breach/close above is needed to shift the medium-term focus higher with key resistance steady at 1519/22. Initial weekly support rests with the monthly trendline backed by the monthly open at 1472 and the monthly opening-range lows / key support at 1451/61- look for a bigger reaction there IF reached.
GOLD PRICE CHART - XAU/USD 120MIN
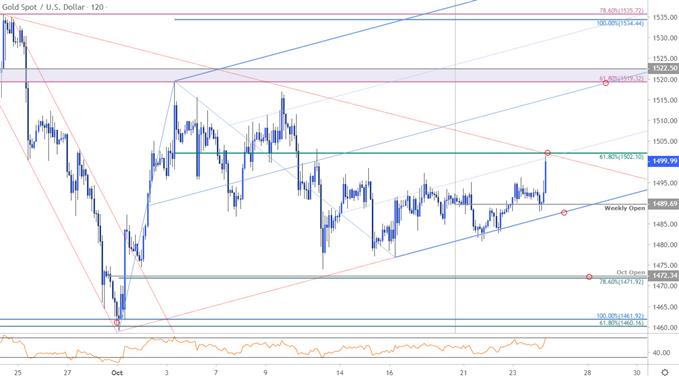
Notes: A closer look at gold price action shows XAU/USD continuing to coil into the monthly opening-range with price holding within the confines of an ascending pitchfork formation extending off the monthly lows. Gold is testing confluence resistance now at 1502- a region defined by the 61.8% retracement and the September trendline. IF price fails here (ahead of 1505), look for a break below slope support to fuel the next leg lower in price.
Bottom line: We’re on the lookout for breakout of the 1472–1505 range. From a trading standpoint, a good spot to reduce long-exposure / raise protective stops. We’ll favor fading weakness IF this holds targeting a break below the weekly open. Ultimately, a larger pullback in gold would likely offer more favorable long-entries close to trend support with a breach above the September trendline needed to shift the focus higher.
GOLD TRADER SENTIMENT - XAU/USD PRICE CHART
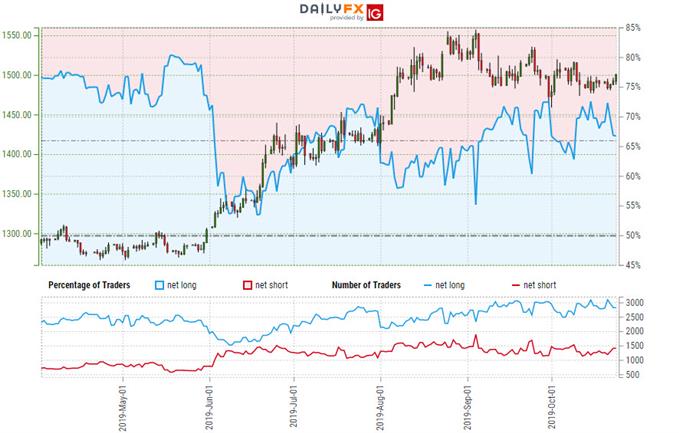
- A summary of IG Client Sentiment shows traders are net-long Gold- the ratio stands at +2.13 (68.02% of traders are long) – bearish reading
- Long positions are0.35% higher than yesterday and 0.69% lower from last week
- Short positions are6.50% lower than yesterday and 2.42% higher from last week
- We typically take a contrarian view to crowd sentiment, and the fact traders are net-long suggests Gold prices may continue to fall. Traders are more net-long than yesterday but less net-long from last week. The combination of current positioning and recent changes gives us a further mixed Gold trading bias from a sentiment standpoint.


