
The precious metal is running higher on the back of a weaker US dollar and is testing a former area of support turned resistance. Gold will need to make a confirmed break of $1,730/oz. though if the backdrop for the precious metal is to turn bullish.
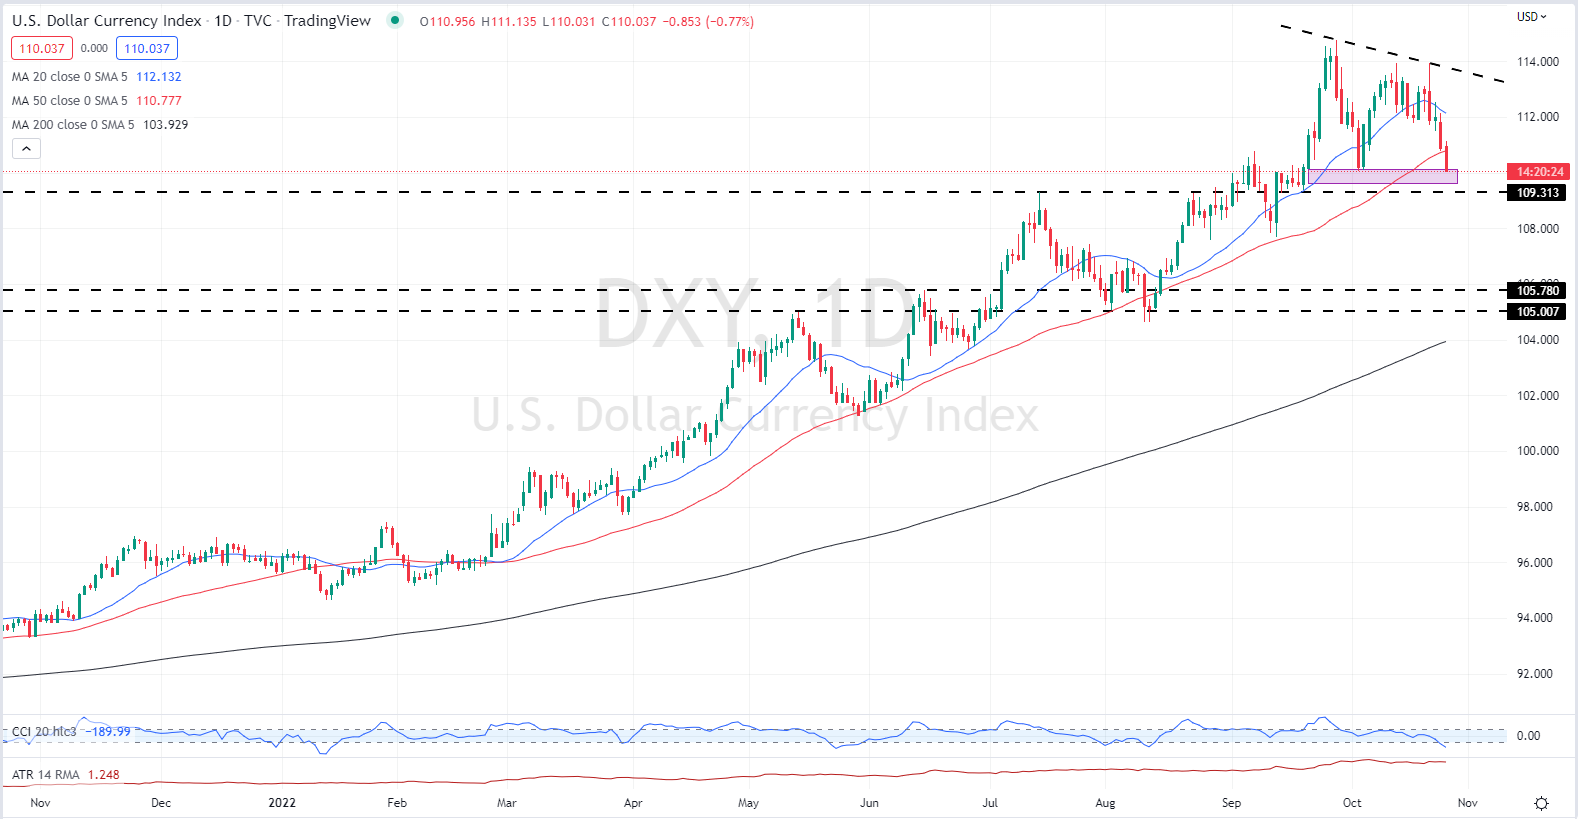
The US dollar is sitting on a zone of support that has held for the last month and is making a double-bottom pattern in the process. This technical pattern normally suggests a price reversal, from bearish to bullish, but a break of the neckline - currently around 113.85 - is needed to confirm this set-up. A break and open below this area however leaves the US dollar likely to re-test a prior swing high and a cluster of prior lows around the 109.30 level.
US Dollar Currency Index Daily Chart
(Click on image to enlarge)
For all market-moving data releases and events, see the DailyFX Economic Calendar.
Gold remains stuck in a downtrend with a series of lower highs and lower lows intact. The rebound off the double-low is around $1,616/oz. has given the precious metal a slightly more positive outlook but sterner tests lie ahead. Around $10 above the current spot price lies a zone of resistance made off a prior swing low and a cluster of, mainly, failed attempts to break higher. The early October break higher was quickly reversed and this area has held gold at bay over the last 2-3 weeks. If gold can break this area, for the chart to turn positive the last swing low at $1,731/oz. would need to be broken. This may be difficult in the current climate.
Gold Daily Price Chart
(Click on image to enlarge)
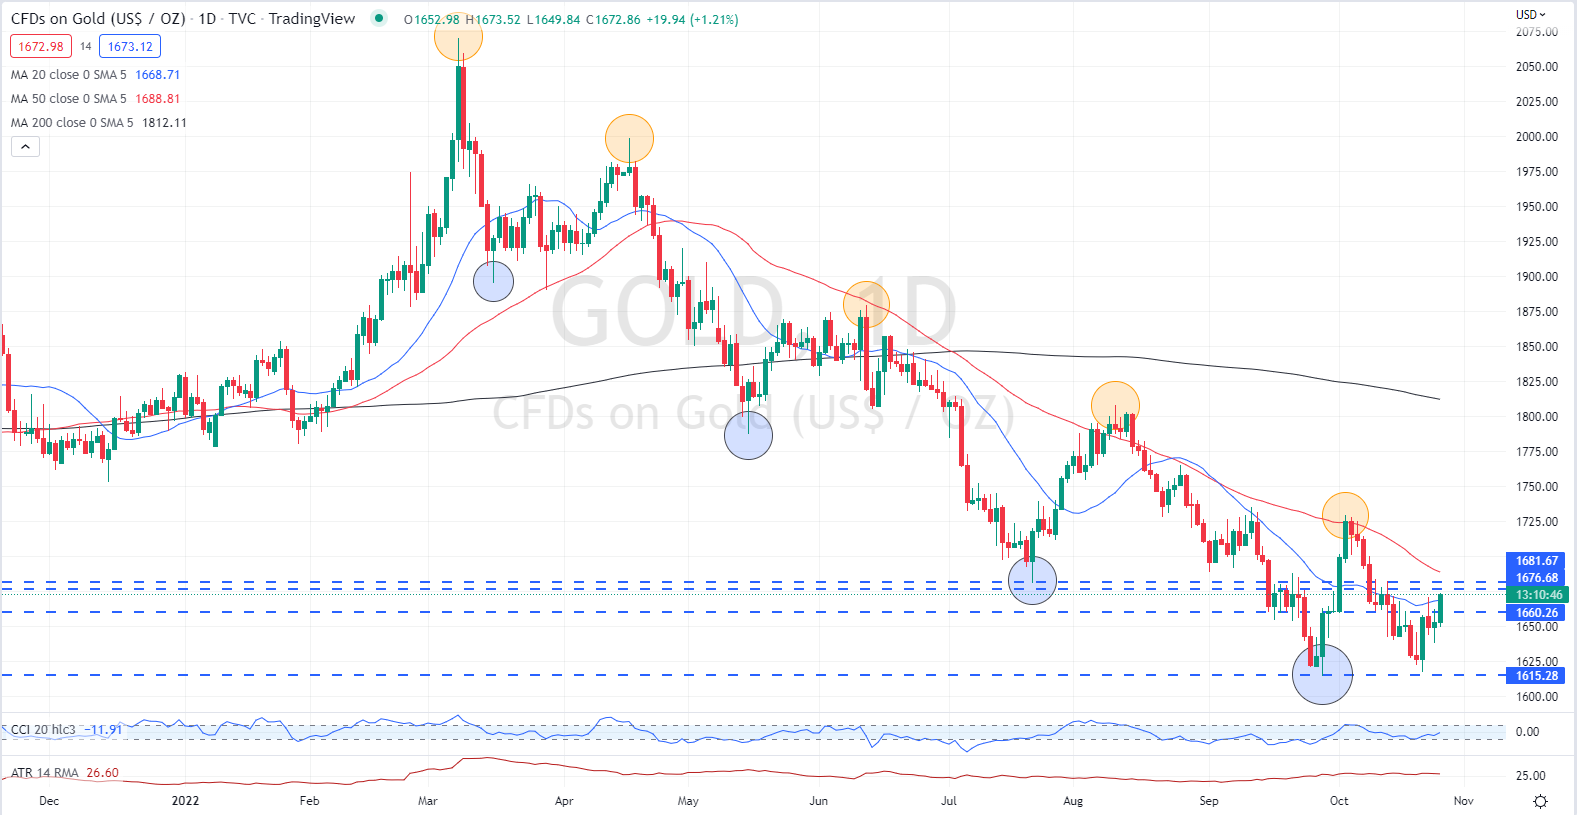
Chart via TradingView
Retail trader data show that 83.91% of traders are net-long with the ratio of traders long to short at 5.22 to 1. The number of traders net-long is 0.87% lower than yesterday and 4.05% higher than last week, while the number of traders net-short is 7.08% higher than yesterday and 6.70% lower than last week.
We typically take a contrarian view to crowd sentiment, and the fact traders are net-long suggests Gold prices may continue to fall. Positioning is less net-long than yesterday but more net-long from last week. The combination of current sentiment and recent changes gives us a further mixed Gold trading bias.
What is your view on Gold – bullish or bearish?
More By This Author:
Japanese Yen Latest: USD/JPY Consolidating, Further Volatility Ahead
British Pound Forecast: Increased GBP Volatility as Tory MPs Decide on a New Leader
US Dollar (USD) Primed For The Next Move Higher As US Treasury Yields Rally


Comments
Log in or sign up to join the conversation.