

The price of gold increases for the second day to largely track the rise across precious metals, and bullion may stage a larger recovery over the coming days as the update to the US Personal Consumption Expenditure (PCE) Price Index is anticipated to show a slowdown in inflation.
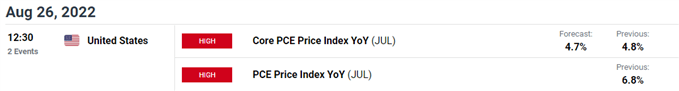
The core PCE, the Federal Reserve’s preferred gauge for inflation, is expected to narrow to 4.7% in July from 4.8% per annum the month prior, and signs of easing price pressures may prop up the price of gold as it dampens bets for another 75bp rate hike.
In turn, the development may encourage the Federal Open Market Committee (FOMC) to adjust its approach in combating inflation as the central bank acknowledges that “it likely would become appropriate at some point to slow the pace of policy rate increases,” and it remains to be seen if the committee will alter the forward guidance at its next interest rate decision on September 21 as Chairman Jerome Powell and Co. are slated to update the Summary of Economic Projections (SEP).
Until then, the price of gold may stage a larger rebound as it snaps the series of lower highs and lows from last week, but speculation surrounding the Fed’s hiking-cycle may influence the precious metal as the central bank prepares US households and businesses for a restrictive policy.
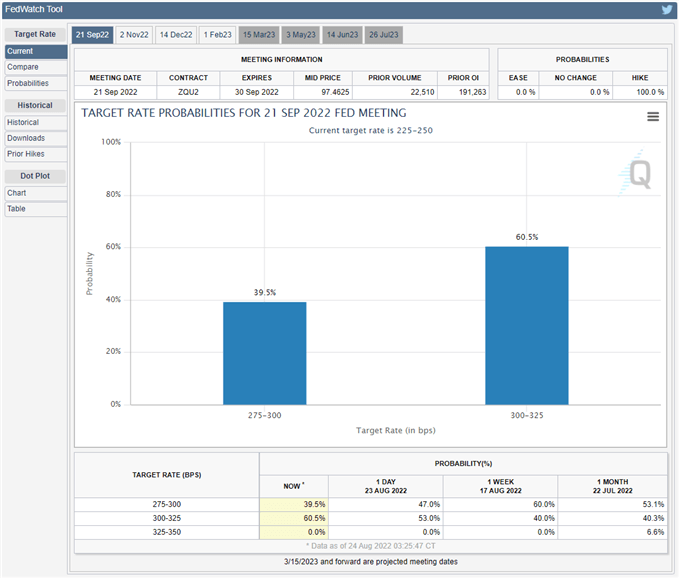
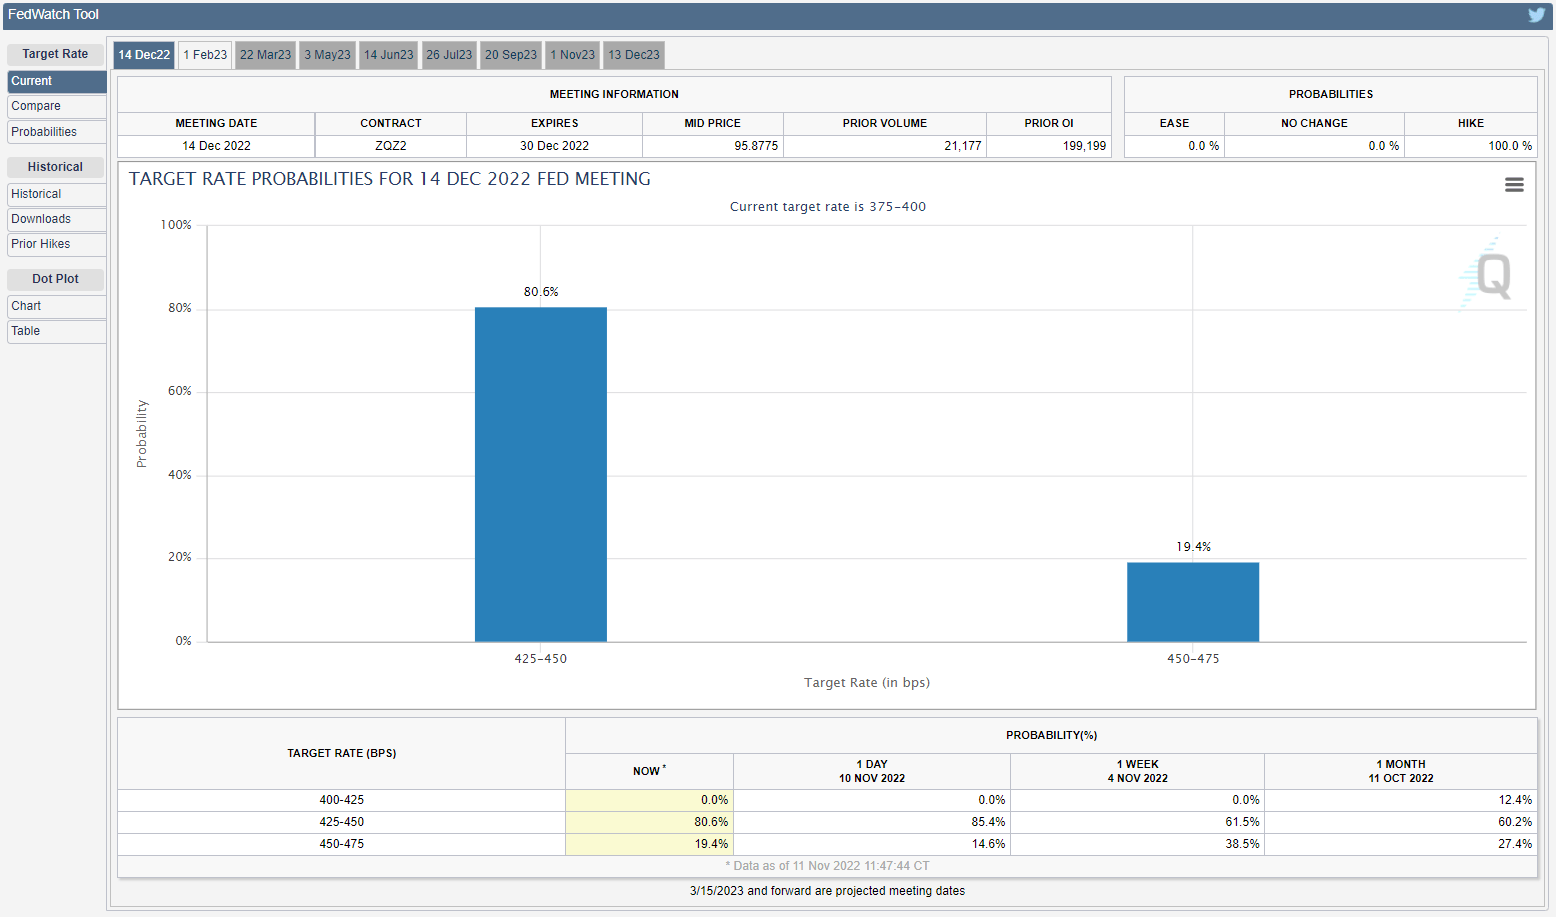
Source: CME
In turn, the price of gold may continue to track the negative slope in the 50-Day SMA ($1769) as the CME FedWatch Tool now reflects a 60% probability for a 75bp rate hike, and the precious metal may face headwinds over the remainder of the year if the central bank forecasts a steeper path for US interest rates.
With that said, a slowdown in the US PCE index may lead to a larger rebound in the price of gold as it encourages the FOMC to implement smaller rate hikes, but the advance from the yearly low ($1713) may turn out to be a correction in the broader trend as the precious metal fails to defend the opening range for August.
GOLD PRICE DAILY CHART
(Click on image to enlarge)
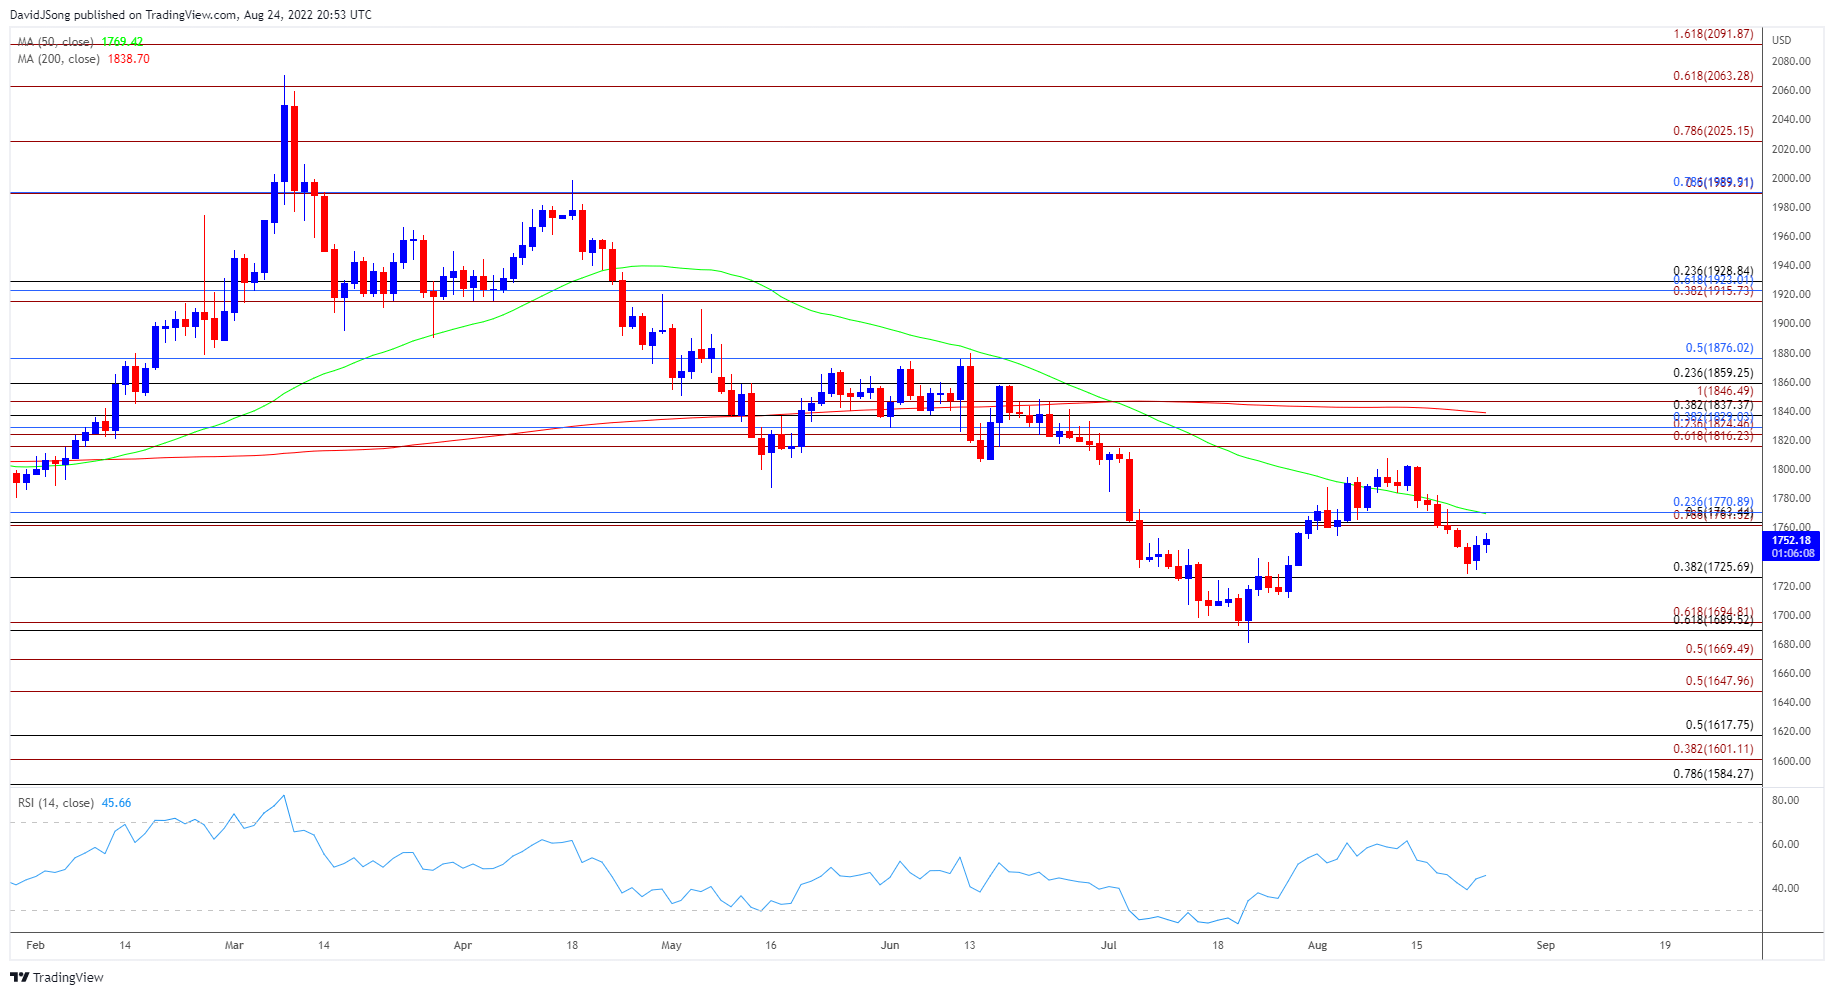
Source: Trading View
- The price of gold has failed to defend the opening range for August after reversing ahead of the July high ($1814), but recent price action raises the scope for a larger rebound in bullion as it snaps the series of lower highs and lows from last week.
- Need a break/close above the Fibonacci overlap around $1761 (78.6% expansion) to $1771 (23.6% retracement) to bring the monthly high ($1808) on the radar, with the next area of interest coming in around $1816 (61.8% expansion).
- However, the price of gold may continue to track the negative slope in the 50-Day SMA ($1769) if it fails to push above the moving average, with a break/close below the $1726 (38.2% retracement) region opening up the $1690 (61.8% retracement) to $1695 (61.8% expansion) area.
More By This Author:
EUR/USD Eyes December 2002 Low After Failing to Defend July Low
Gold Price Forecast: Bullion To Find Relief On Slowing US Inflation
Gold Price Threatens Monthly Low After Failing to Test July High

Comments
Log in or sign up to join the conversation.