
Gold Price Outlook: XAU/USD Spikes, Snaps Back To Fibonacci Support
GOLD PRICES SPIKE AT THE OPEN, SNAP BACK FADES GAINS
Last week finished with a bang and it likely came from areas of the market that not many were expecting. Jerome Powell’s Jackson Hole speech did take on a dovish tone, with the FOMC Chair saying that the bank will do what’s needed to continue the expansion. But just a couple hours before he took the stage the ongoing US-China trade war got another ramp of volatility when China announced additional tariffs on US goods. This may have helped to prod that slightly-more-dovish Jerome Powell, but the Fed Chair’s speech is not where matters finished. Later in the day President Trump talked up even more tariffs on China, and that was walked back over the weekend.
Given the weekend events, risk aversion spiked at the open with Gold prices temporarily trading-above the 1555 level. That move has since pulled back with almost the entirety of those gains now given back and price action returning back towards last week’s close.
GOLD PRICE FOUR-HOUR CHART
(Click on image to enlarge)
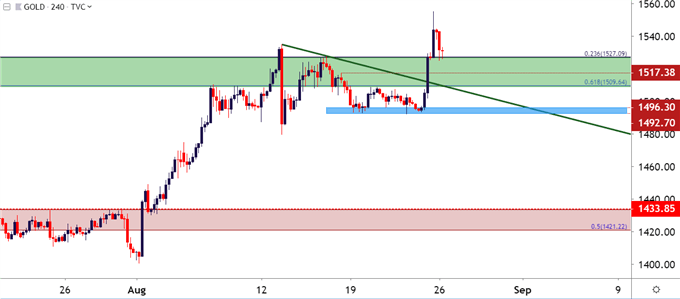
Chart prepared by James Stanley; Gold on Tradingview
CAN GOLD HOLD THE BID WITH A MESSY FUNDAMENTAL BACKDROP?
Gold prices have been strongly bid for a full year now after bottoming-out around 1160 in August of last year. This topside move has had a few different drivers along the way, with the initial push coming from softening expectations around the Federal Reserve and that hastened through Q1 of 2019. More recently, however, a bit of fear has entered into the equation around the ongoing trade rift with China, perhaps best evidenced earlier this month. That’s when Gold prices softened on the heels of the FOMC rate decision, even as the bank cut rates for the first time in a decade; but a strong bid followed as President Trump announced another round of tariffs on China.
This collectively produces a fairly bright backdrop on the fundamental side of Gold prices. Ongoing trade tensions will likely be met with softer monetary policy out of the Fed; both factors that can further contribute to bullish stances in Gold. =The issue at the moment is in just how strong this theme has been getting priced-in with Gold prices moving to their most overbought state since 2011, right around the time that price action topped-out above the 1900 level. Since those lows last August, Gold prices have gained as much as 34% going out to this morning’s swing-high.
GOLD WEEKLY PRICE CHART
(Click on image to enlarge)
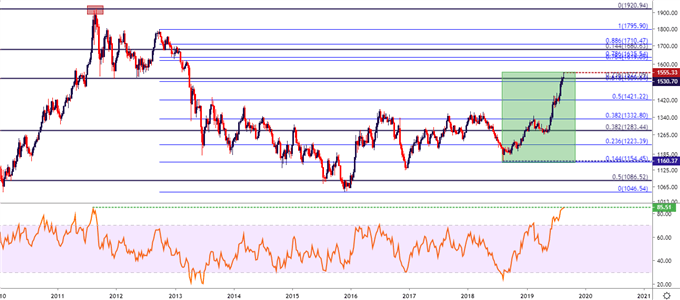
Chart prepared by James Stanley; Gold on Tradingview
GOLD PRICE STRATEGY
Given the overbought longer-term backdrop with a fundamental scenario that could continue to lead to further gains, and traders have a couple of options for approaching the topside of Gold at the moment. Breakout potential remains, looking for spikes to fresh highs to carry on. This would be similar to the setup looked at last week in which breakout potential existed at the Fibonacci levels of 1509 up to the 1527 marker.
Alternatively, traders can look pullbacks to support that could re-open the door for defined risk plays. Key for such approaches will be actually confirming that support is actually showing at the level so that stops can be held below those lows; and if prices do continue to break-down, losses could be mitigated, and bullish entries could be re-examined later.
Aggressive support could be sought out around the current level should buyers help to hold the lows here today. This comes in at 1527 and this price provided a bit of resistance on Friday as well as a lower-high two weeks ago. This is the 23.6% Fibonacci retracement of the 1999-2011 major move in Gold. A bit-lower is another Fibonacci level of interest at 1509, as this is the 61.8% marker of the 2012-2015 sell-off. And below that is the zone that helped to hold last week’s lows that runs from the approximate 1492-1496.
GOLD PRICE TWO-HOUR CHART
(Click on image to enlarge)
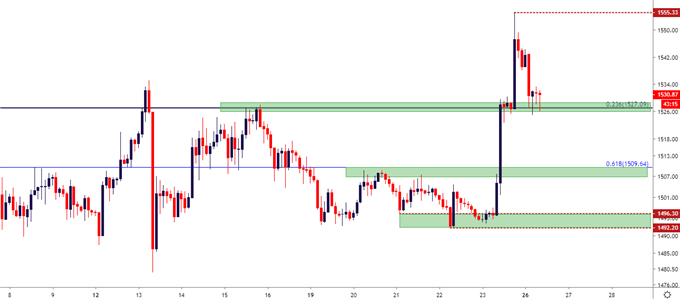
Chart prepared by James Stanley; Gold on Tradingview


