
Gold Price Outlook Hinges On Fed Rhetoric, US NFP Report

GOLD PRICE TALKING POINTS
Fresh developments coming out of the US are likely to influence the price of gold amid overwhelming expectations for a Federal Reserve rate cut in September.
FUNDAMENTAL FORECAST FOR GOLD: NEUTRAL
The price of gold climbed to a fresh yearly high ($1555) during the last full week of August amid growing tensions between the US and China, and the escalating trade war may force the Federal Reserve to further insulate the economy as President Donald Trump tweets that the “Fed has been calling it wrong for too long.”
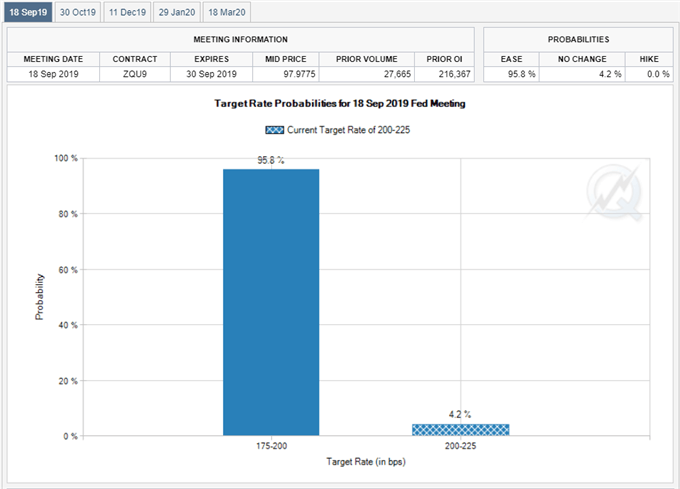
As a result, Fed Fund futures show a greater than 90% probability for a 25bp reduction on September 18, but little signs of a looming recession may spur a greater dissent within the Federal Open Market Committee (FOMC) as the Atlanta Fed GDPNow model now projects the US economy to expand 2.3% in the third quarter of 2019 compared to 2.2% on August 16.
Moreover, recent remarks from Chairman Jerome Powell suggest the Fed is in no rush to embark on a rate easing cycle as monetary policy “cannot provide a settled rulebook for international trade,” and upcoming remarks from Boston Fed President Eric Rosengren, New York Fed President John Williams and Chicago Fed President Charles Evans, all 2019-voting members on the FOMC, may impact financial markets as the central bank comes under pressure to reverse the four rate-hikes from 2018.
With that said, it remains to be seen if the US Non-Farm Payrolls (NFP) report will spur a meaningful reaction amid overwhelming expectations for back-to-back Fed rate cuts, and a positive development may stoke fears of a policy error as Fed officials project a lower trajectory for the benchmark interest rate.
In turn, market participants may search for an alternative to fiat currencies, and falling US Treasury yields along with the inverting yield curve are likely heighten the appeal of gold as the US-China trade war appears to be a spurring a flight to safety.
GOLD PRICE DAILY CHART
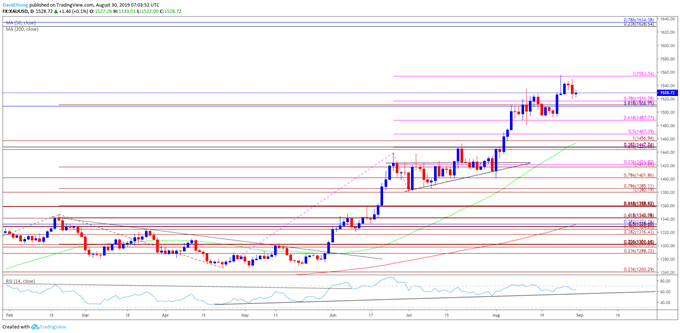
Source: Trading View
Keep in mind, the broader outlook for gold prices remain constructive as both price and the Relative Strength Index (RSI) clear the bearish trends from earlier this year.
Moreover, gold has broken out of a near-term holding pattern following the failed attempt to close below the $1402 (78.6% expansion) region, with the RSI still tracking the bullish formation from April.
However, the failed attempts to close below $1554 (100% expansion) may generate a short-term pullback in the price of gold as the RSI struggles to push back into overbought territory, with a break/close below the Fibonacci overlap around $1509 (61.8% retracement) to $1517 (78.6% expansion) raising the risk for a move towards $1488 (61.8% expansion).


