Gold Price Outlook Hinges On Fed Rhetoric, US-China Trade Negotiation

GOLD PRICE TALKING POINTS
Upcoming remarks from Federal Reserve officials may influence the price of gold as the central bank alters the outlook for monetary policy.
FUNDAMENTAL FORECAST FOR GOLD: NEUTRAL
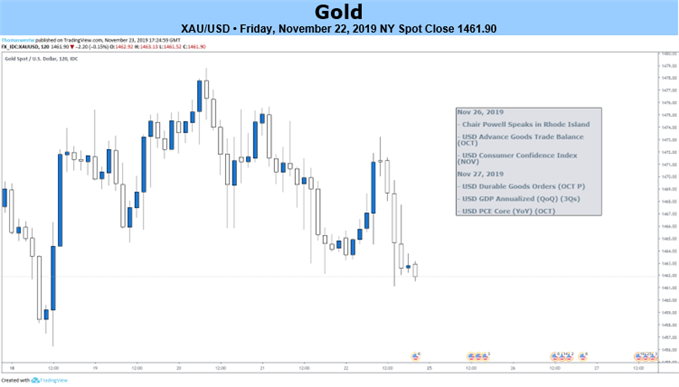
The price of gold struggles to retain the rebound from the monthly low ($1446) amid renewed hopes for a US-China trade deal.
The ongoing negotiations may encourage the Federal Open Market Committee (FOMC) to move away from its rate easing cycle as officials see “the current stance of monetary policy as likely to remain appropriate.”
In fact, recent remarks from Fed officials suggest the central bank will move to the sideline and retain the current policy at its last meeting for 2019 as New York Fed President John Williams, a permanent voting-member on the FOMC, also states that “the current stance of monetary policy seems appropriate.”
In turn, Chairman Jerome Powell and Governor Lael Brainard may strike a similar tone next week as both officials are slated to speak, and a batch of less dovish comments may drag on the price of gold as the central bank tames speculation for another rate cut in 2019.
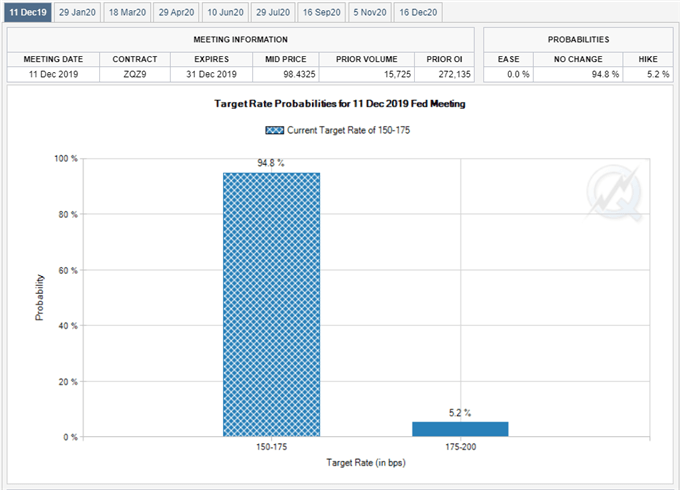
TARGET RATE PROBABILITIES FOR DEC. 11TH FED MEETING

As a result, Fed Fund futures reflect a greater than 90% probability the FOMC will retain the current policy on December 11, and the central bank may larger endorse a wait-and-see approach ahead of 2020 after delivering three consecutive rate cuts this year.
However, it remains to be seen if Chairman Powell and Co. will project a lower trajectory for the benchmark interest rate when the central bank updates the Summary of Economic Projections (SEP), and the FOMC may keep the door open to implement lower interest rates as the Trump administration plans toslap additional tariffs on China in December.
With that said, comments from Fed officials along with headlines surrounding the US-China trade negotiation may sway gold prices as the central bank insulates the economy from the shift in US trade policy. Nevertheless, the reaction to the former-resistance zone around $1447 (38.2% expansion) to $1457 (100% expansion) helps to rule out the threat of a Head-and-Shoulders formation as the price for bullion snaps the string of lower highs and lows carried over from the previous week.
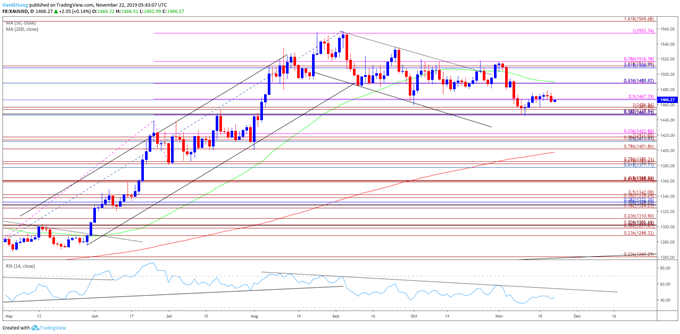
GOLD PRICE DAILY CHART

Source: Trading View
Keep in mind, the broader outlook for gold prices remain constructive as both price and the Relative Strength Index (RSI) clear the bearish trends from earlier this year, with the precious metal trading to a fresh yearly-high ($1557) in September.
However, the near-term correction in the price for gold has been accompanied by a bearish formation in the RSI, with the pattern offering a mixed signal as a bull flag formation also takes shape.
With that said, the reaction to the Fibonacci overlap around $1447 (38.2% expansion) to $1457 (100% expansion) may to rule out the threat of a Head-and-Shoulders formation as the former-resistance zone appears to be acting as support.
Still need a break/close above the $1509 (61.8% retracement) to $1517 (78.6% expansion) region to bring the topside targets on the radar, with the first topside hurdle comes in around $1554 (100% expansion), which largely lines up with the yearly-high ($1557).


