
The tide appears to have turned, just as it did at the crucial moment in 2008. And just like was the case back then, it seems that most people missed it.
The thing is that people are usually concerned with very short-term news and price moves:
Gold rallied by $X, yesterday!
Rates were just hiked by x%!
And so on…
In reality, these events are just triggers for events that are unfolding in tune with long-term trends and analogies. Some of those triggers make perfect sense, and some don’t, as markets can act in the “buy-the-rumor-sell-the-fact” mode, thus greatly perplexing those who expect the market moves to always be in tune with the news that was just announced.
Boy, were those folks surprised when the rates were cut by 0.75% back in 2008 and the stock market still plunged!
There are myriads of such examples, and examining them leads to one major takeaway. Even though it might seem exciting and very important to focus on those immediate-term events, it is actually the analysis of trends, technicals, and analogies to previous situations that actually brings useful insights that can then help one make profitable trades. Of course, no technique is perfect, and nobody, including yours truly, can guarantee any kind of performance, but based on two decades of my experience in the precious metals market, I see how useful this is, especially compared to any attempts to guess what the next “unexpected news” is going to be (hint: even if it happens as one had thought, it sometimes has a different effect than one had expected).
When forecasting gold prices, it’s no different. Focusing on the big picture comes first, and spotting analogies to what has already happened is second. Trying to guesstimate what’s about to take place in the news is much further down the list.
The space here is limited (and so is everyone’s time), so to make a long story short, the big picture for gold is not as bullish as it might seem based on its most recent move above $2,000. No. Gold is barely above its 2011 high in nominal terms (not to mention real terms), despite loads of dollars being printed in the meantime and even despite the war outbreak in Europe.
Silver and mining stocks are much below their 2011 highs – in fact, mining stocks are even well above their 2008 highs in many cases.
This doesn’t show the strength of the market, but rather its weakness.
As far as analogies to the previous cases go, gold, silver, and mining stocks appear to be repeating their performances from previous periods, and the most important of the analogies seems to be the one to what happened in 2008.
The reason is that it’s not only visible from a technical point of view, and it’s not only visible across many markets, but actually some of the fundamental news surrounding the price moves are similar.
Starting with the latter, the rates are moving up, and that was also what preceded the 2008 slide (not directly, but still). And do you remember the Lehman collapse that was one of the first dominoes to fall? This time, it was the Silicon Valley Bank.
Ultimately, in the aftermath of all this, both gold and silver prices plunged profoundly, but there was a huge counter-trend rally first.
What did gold do back then? It soared for about a week, then traded sideways before finally topping slightly higher than it did initially.

While gold soared, the USD Index declined on a short-term basis, the mining stocks moved higher, but overall they followed the general stock market, and… There was a sharp upswing in crude oil prices (as seen on the bottom of the above chart), even though it’s been in a medium-term downtrend.
It all happened recently, too. Even the sharp upswing in crude oil!

The price of black gold just jumped, despite being in a medium-term downtrend.
Stock prices are currently moving sideways on a medium-term basis, but their most recent move was to the upside.

It currently looks like the right shoulder of the head-and-shoulders formation is being formed. The RSI reading shows similarity to what happened in mid-2022, and then a massive decline followed. Of course, not two periods are identical, but they are similar enough for the implications to be bearish at this time.
This is especially the case given that the volume has been visibly decreasing during the current upswing – exactly like it was in mid-2022.
Consequently, the current short-term forecast for stock prices is bearish.
This means that the implications for mining stocks are also bearish since those two markets (mining stocks are stocks, after all!) are connected – and this is the case just like it was back in 2008.
The USD Index appears to have just finished its short-term decline, which is a correction within a bigger uptrend.
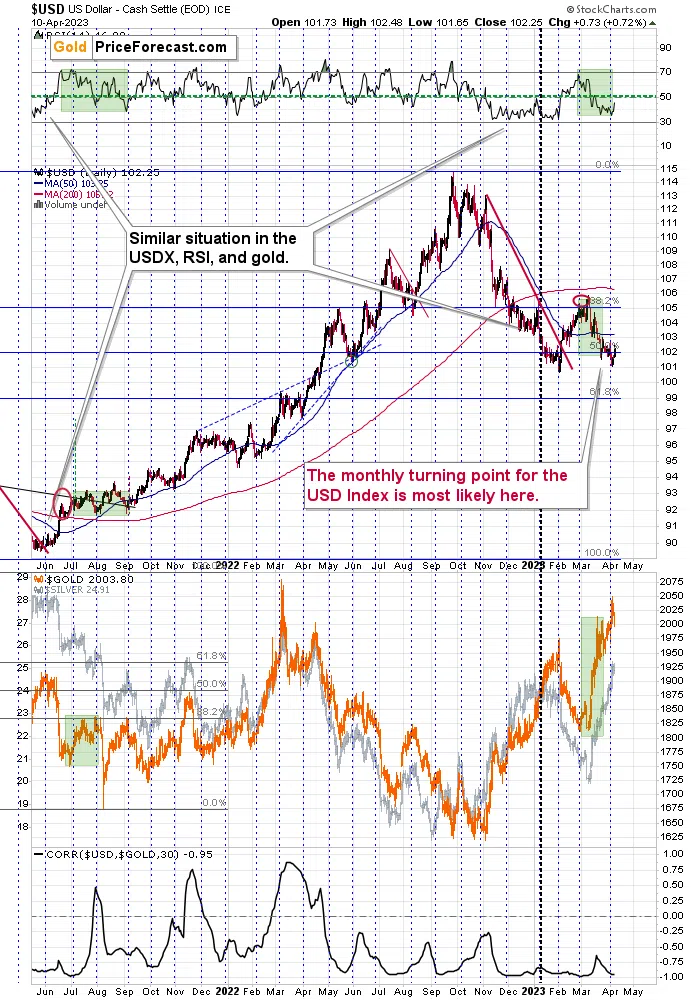
Again, that’s something that we’ve seen in 2008. Back then, the move lower in the USD Index took less time, but let’s keep in mind that history tends to rhyme rather than repeat itself to the letter.
There’s a specific pattern present on the USD Index that affects quite many forex forecasts (not surprising given the USD Index is ultimately a weighted average of forex pairs).
Namely, the U.S. currency tends to reverse directions close to the turn of the month. That’s what I marked with dashed lines on the above chart. It seems that this technique worked once again, and a local bottom was formed.

Zooming in allows us to see that the USD Index actually managed not only to break above its declining resistance line but also verify this breakout and then rally once again.
This – combined with the above-mentioned monthly seasonal tendency – makes it very likely that the bottom is in for the USD Index.
Given the negative correlation between gold and the USD Index, it seems that the top in gold is in as well.
Let’s take a look at the gold price itself.

After a sharp rally – that lasted about a week (just like in 2008!) – gold price started to move sideways, and recently it moved to a new intraday high.
Unless one is aware of the bearish analogy to 2008, the above might seem bullish, but given the carnage that followed in 2008, gold’s recent behavior is not bullish at all. It’s bearish.
The fact that gold just moved back below $2,000 on an intraday basis only adds to the bearish implications of the recent price movement.
What does it all mean?
It means that despite a positive movement in gold in the last several weeks, gold price analysis actually suggests that a very bearish surprise awaits those, who are taking the price moves at face value.
More By This Author:
Another Extra Profit OpportunityIs The Time For Gold Up Yet?
Bitcoin Price And The Outlook For Junior Mining Stocks


Comments
Log in or sign up to join the conversation.