Tuesday, December 10, 2019 6:15 AM EDT
GOLD PRICE ANALYSIS:
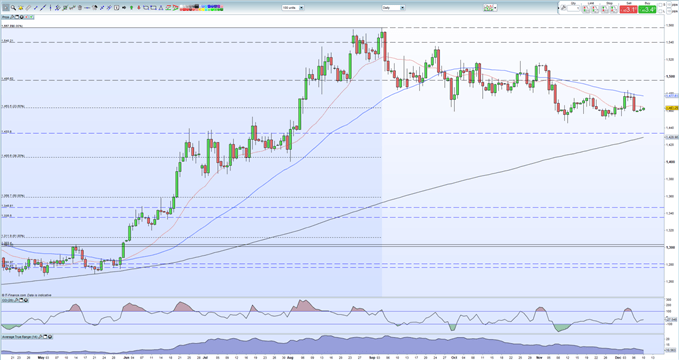
There is a raft of high importance risk event scheduled this week, all capable of changing risk sentiment. Gold continues to push marginally higher but remains constrained. The spot price is currently trading either side of the 23.6% Fibonacci retracement level at $1,463.5/oz. with the 20-day moving average currently just $1 higher. The 20-dma was broken last week but the move has re-traced and above here the 50-dma continues to act as resistance. Gold will need to break above all three of these indicators to move higher with the December 4 high of $1,484.5/oz. the initial target, before $1,500/oz. and the cluster of recent highs around $1,515/oz. and $1,520/oz. Gold’s volatility – measured by ATR – is at multi-month lows.
GOLD PRICE CHART (APRIL -DECEMBER 10, 2019)
SILVER PRICE ANALYSIS:
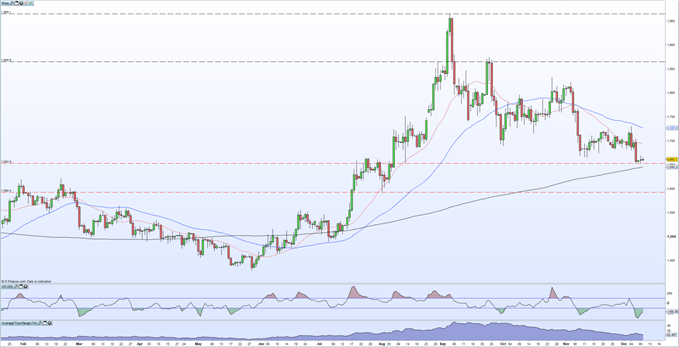
Silver continues to respect support around the $16.50 level, a trading area last seen four-months ago. The technical set-up remains neutral but if silver respects the 200-dma, currently around $16.45, then it may look to push higher, especially as the CCI indicator shows that the market is currently oversold. If silver can hold these levels, then a break higher is looking likely, especially if it can break the recent sequence of lower highs by closing above $17.31. This would also see both the 20- and 50-day moving averages broken. As with gold, volatility is at a multi-month low.
SILVER PRICE DAILY CHART (JANUARY – DECEMBER 10, 2019)
Disclaimer: DailyFX, the free news and research website of leading forex and CFD broker FXCM, delivers up-to-date analysis of the ...
more
Disclaimer: DailyFX, the free news and research website of leading forex and CFD broker FXCM, delivers up-to-date analysis of the fundamental and technical influences driving the currency and commodity markets. With nine internationally-based analysts publishing over 30 articles and producing 5 video news updates daily, DailyFX offers in-depth coverage of price action, predictions of likely market moves, and exhaustive interpretations of salient economic and political developments. DailyFX is also home to one of the most powerful economic calendars available on the web, complete with advanced sorting capabilities, detailed descriptions of upcoming events on the economic docket, and projections of how economic report data will impact the markets. Combined with the free charts and live rate updates featured on DailyFX, the DailyFX economic calendar is an invaluable resource for traders who heavily rely on the news for their trading strategies. Additionally, DailyFX serves as a portal to one the most vibrant online discussion forums in the forex trading community. Avoiding market noise and the irrelevant personal commentary that plague many forex blogs and forums, the DailyFX Forum has established a reputation as being a place where real traders go to talk about serious trading.
Any opinions, news, research, analyses, prices, or other information contained on dailyfx.com are provided as general market commentary, and does not constitute investment advice. Dailyfx will not accept liability for any loss or damage, including without limitation to, any loss of profit, which may arise directly or indirectly from use of or reliance on such information.
less
How did you like this article? Let us know so we can better customize your reading experience.


 No Thumbs up yet!

