
Gold Price Halts Three-Day Selloff As Fed Refrains From Quantitative Tightening

The breakout in the price of gold appears to have reversed ahead of the record high ($2075) as the recent weakness pulls the Relative Strength Index (RSI) back from overbought territory, and swings in risk appetite may influence the precious metal as the Russia-Ukraine war along with the renewed lockdown in China sways investor confidence.
However, the price of gold attempts to halt a three-day sell off even as the Federal Open Market Committee (FOMC) delivers a 25bp rate hike as the central bank appears to be on a preset course in normalizing monetary policy.
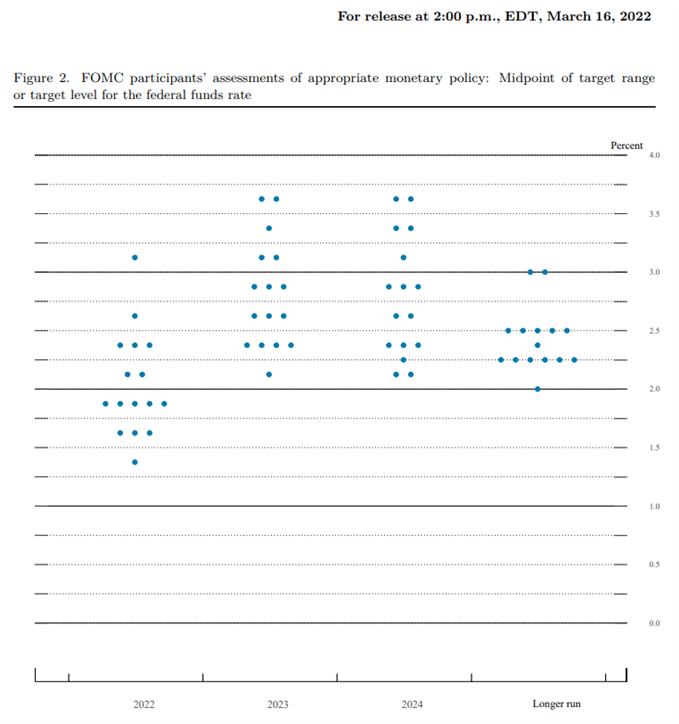
Source: FOMC
The update to the Summary of Economic Projections (SEP) suggest the FOMC will deliver a series of rate hikes over the coming months as Chairman Jerome Powell and Co. see the benchmark interest rate above 2.00% in 2022, and it remains to be seen if the central bank will ramp up its efforts to achieve price stability as Fed officials project a steeper path for US interest rates.
However, it seems as though the FOMC is in no rush to winddown its balance sheet as “the Committee expects to begin reducing its holdings of Treasury securities and agency debt and agency mortgage-backed securities at a coming meeting,” and the lack of details surrounding the quantitative tightening (QT) cycle may keep the price of gold afloat as inflation becomes a growing concern for major central banks.
With that said, the decline from the yearly high ($2070) may turn out to be a correction in the broader trend as the Fed appears to be in no rush to winddown its balance sheet, and the precious metal may stage a rebound over the coming days if it manages to clear the series of lower highs and lows carried over from last week.
GOLD PRICE DAILY CHART
(Click on image to enlarge)
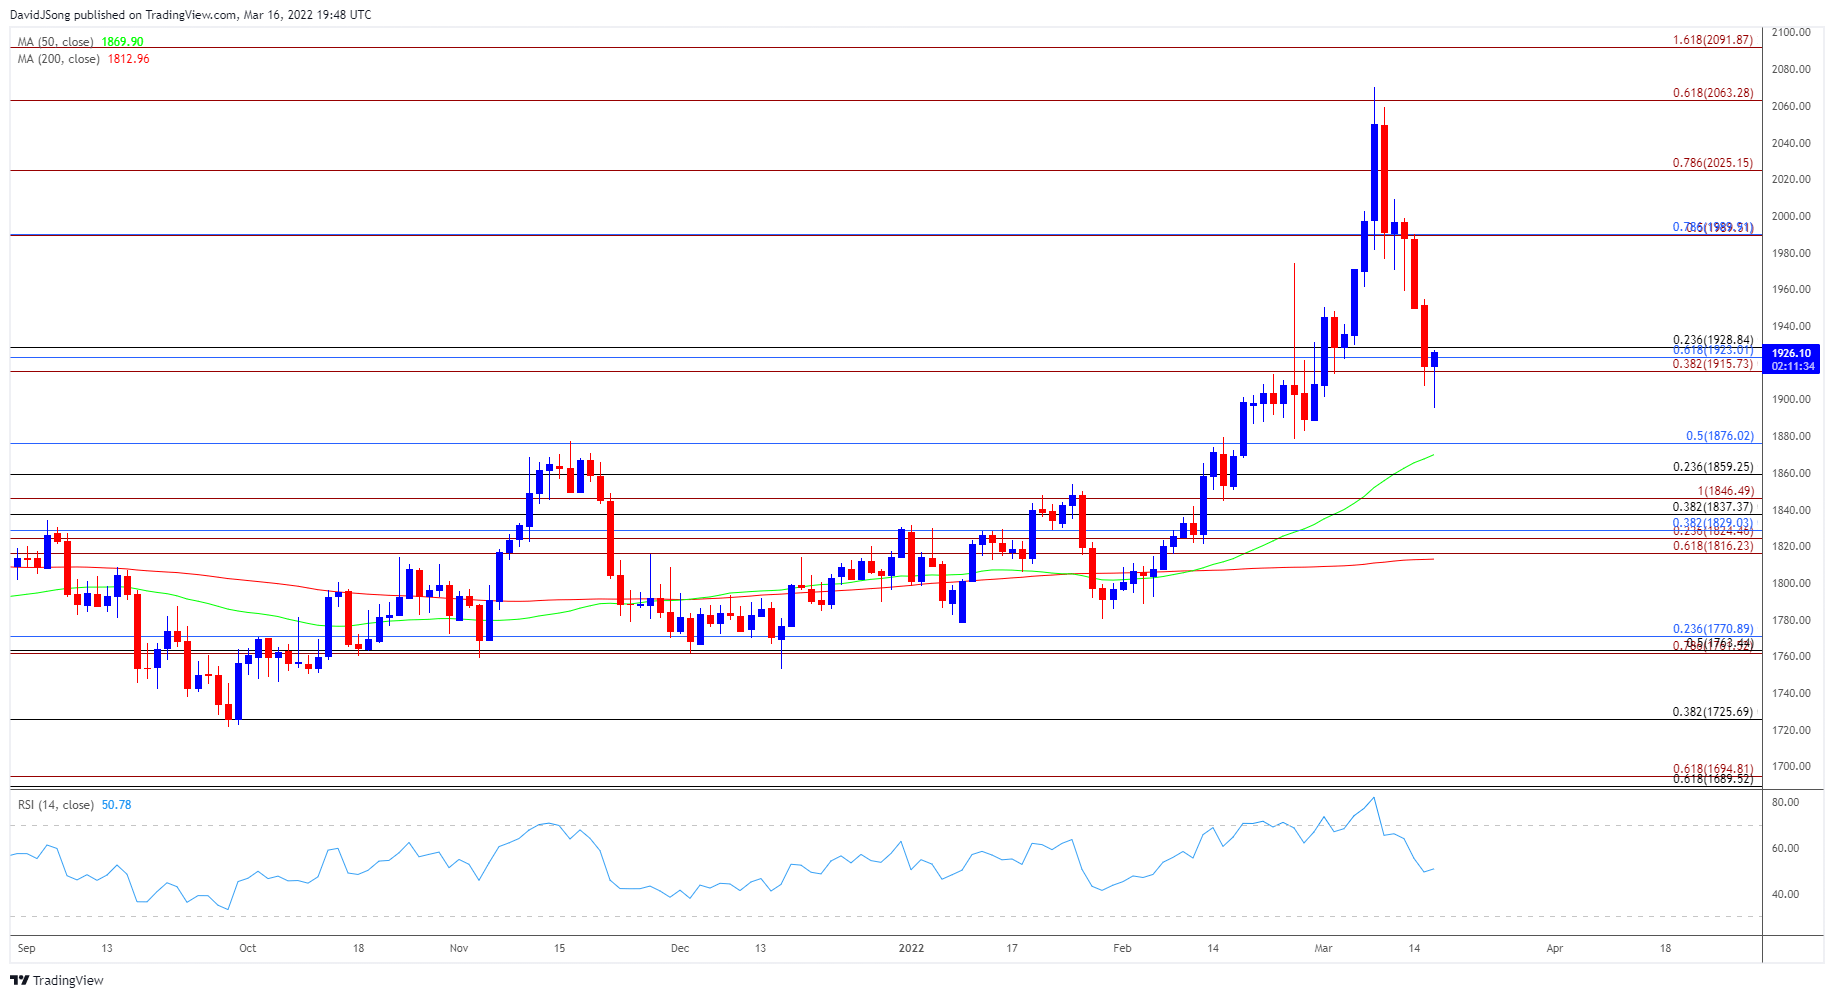
Source: Trading View
- The broader outlook for the price of gold has come constructive as the 50-Day SMA ($1870) develops a positive slope, but bullion has carved a series of lower highs and lows following the failed attempt to test the record high ($2075).
- At the same time, the decline from the yearly high ($2070) generated a sell-signal in the Relative Strength Index (RSI) as the oscillator fell back below 70, with the precious metal taking out the opening range for March as it slipped to a fresh monthly low ($1895).
- Need a close below the Fibonacci overlap around $1916 (38.2% expansion) to $1929 (23.6% retracement) to bring the $1876 (50% retracement) area on the radar, with a move below the 50-Day SMA ($1870) opening up the $1859 (23.6% retracement) region.
- However, failure to close below the overlap around $1916 (38.2% expansion) to $1929 (23.6% retracement) may lead to a near-term rebound in the price of gold if it manages to snap the series of lower highs and lows from last week, with a move above the $1990 (78.6% retracement) area bringing the $2025 (78.6% expansion) region back on the radar.
Disclosure: See the full disclosure for DailyFX here.


