
Gold Price Futures (GC) Technical Analysis – Surges As U.S. Labor Market Data Raises Fed Slowdown Hopes
An uptick in the U.S. unemployment rate in October raised the odds of a potential slowdown in the pace of Federal Reserve rate hikes.

Gold futures soared on Friday as U.S. Treasury yields fell sharply and the U.S. Dollar weakened after a U.S. labor market report showed an uptick in the U.S. unemployment rate in October raised the odds of a potential slowdown in the pace of Federal Reserve rate hikes.
On Friday, December Comex gold futures settled at $1676.60, up 45.70 or 2.73%. The SPDR Gold Shares ETF (GLD) finished at $156.47, up $4.66 or +3.07%.
Non-Farm Payrolls Greater than Forecast, but Jobless Rate Dips
October’s jobs report painted a mixed picture of the labor market.
U.S. Non-Farm Payrolls surged by 261,000, according to data from the Bureau of Labor Statistics. That was much higher than the 205,000 add that economists expected. At the same time, the unemployment rate ticked up slightly to 3.7% from 3.5% a month earlier.
Treasury Yields Eased Dragging U.S. Dollar Lower
The yield on the 2-year Treasury note eased slightly on Friday after hitting a fresh 15-year high. The dollar slumped on Friday in reaction to the drop in yields. This drove up foreign demand for dollar-denominated gold.
At the end of the session, Fed Fund Futures priced in a 51.5% chance of a 75-basis-point interest rate hike next month, and a 48.5% probability of a 50-basis-point increase. The odds of a 75-basis-point rise went as high as 64% immediately after the data.
(Click on image to enlarge)
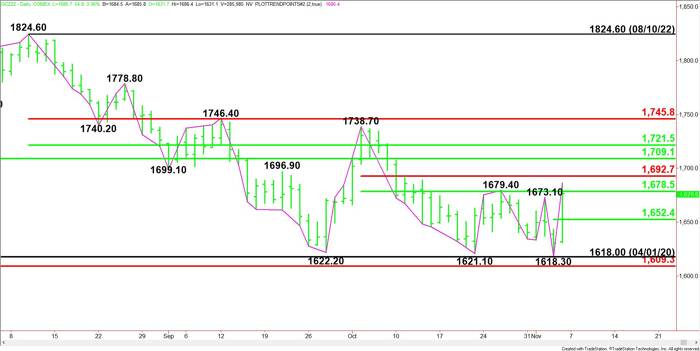
Daily December Comex Gold
Daily Swing Chart Technical Analysis
The main trend is up according to the daily swing chart. The trend turned up on the trade through $1673.10 and was reaffirmed when buyers took out the next swing top at $1679.40. A trade through $1618.30 will change the main trend to down.
The short-term range is $1738.70 to $1618.30. Its retracement zone at $1678.50 to $1692.70 is the first upside target and potential resistance. It stopped the rally on Friday.
The long-term resistance is the 50% level at $1709.10, followed by a retracement zone at $1721.50 to $1745.80.
On the downside, the minor support is a pivot at $1652.40.
Daily Swing Chart Technical Forecast
Trader reaction to the short-term 50% level at $1678.50 is likely to determine the direction of the December Comex gold futures contract early Monday.
Bullish Scenario
A sustained move over $1678.50 will indicate the presence of buyers. This could trigger the start of a labored rally with a series of levels at $1692.70, $1709.10 and $1721.50 potential targets.
Bearish Scenario
A sustained move under $1678.50 will signal the presence of sellers. If this creates enough downside momentum then look for a possible break into the minor pivot at $1652.40. Since the main trend is up, look for buyers on the first test of this level.
More By This Author:
EUR/USD And A Return To Parity In The Hands Of Euro Area Stats5 Things to Know in Crypto Today – Crypto Market Struggles on Fed Bets
ETH And BTC And Returns To Sub-$1,250 And $18,500 In The Fed’s Hands


