
Gold Price Forecast: XAU/USD Trades Cautiously Near $3,330, Fed Powell’s Speech In Focus

Image Source: Pixabay
Gold price (XAU/USD) trades 0.3% lower around $3,330.00 during the European trading session on Friday. The precious metal faces selling pressure as market experts believe that Federal Reserve (Fed) Chair Jerome Powell could reiterate his argument that a “wait and see” approach on the interest rate outlook is appropriate in the current environment in his speech at the Jackson Hole (JH) Symposium at 14:00 GMT.
“The most likely scenario is that Powell won’t provide any definitive clues on what the Fed will do next ahead of critical non-farm payrolls and CPI data,” analysts at Commonwealth Bank said.
The Federal Open Market Committee (FOMC) minutes of the July monetary policy meeting also showed on Wednesday that a majority of members, including Jerome Powell, underscored the need for time to gain absolute clarity on the “magnitude and persistence of higher tariffs’ effects on inflation”.
Ahead of Fed Powell’s speech, traders have also trimmed bets supporting interest rate cuts by the Fed in the September meeting. According to the CME FedWatch tool, the probability of the Fed cutting interest rates in September has eased to 73.3% from 85.4% seen a week ago.
The maintenance of interest rates at higher levels by the Fed bodes poorly for non-yielding assets, such as Gold.
Traders raised Fed dovish bets earlier this month after the release of the Nonfarm Payrolls (NFP) report for July, which showed a significant revision in newly employed workers in May and June on the downside.
On the global front, growing uncertainty over peace between Russia and Ukraine is expected to continue supporting the Gold price. On Thursday, Moscow launched a mass attack on targets in Ukraine. This came at a time when US President Donald Trump is persuading leaders from both nations to end the three-year-long war.
Gold technical analysis
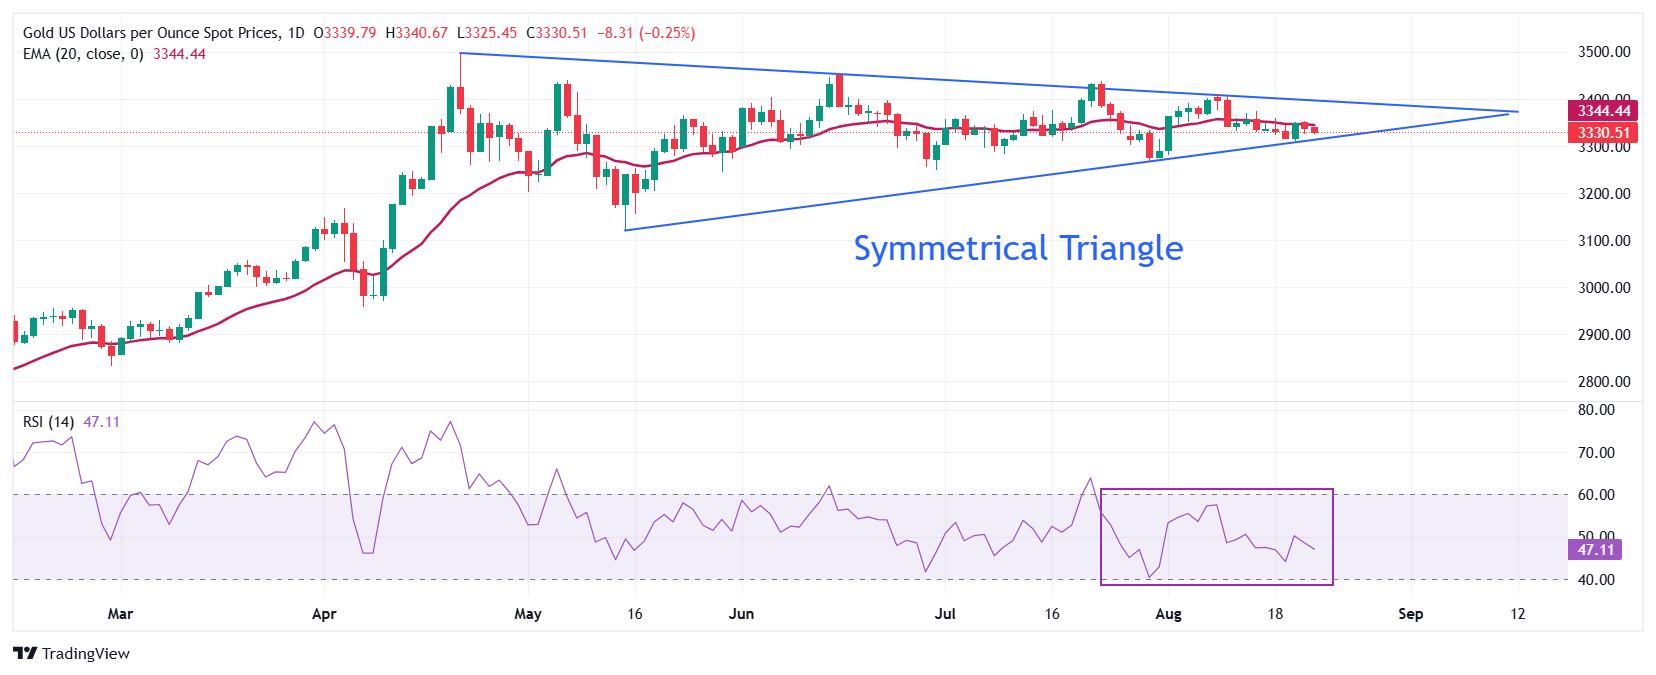
Gold price trades in a Symmetrical Triangle, which indicates a sharp volatility contraction. The upper border of the above-mentioned chart pattern is plotted from the April 22 high around $3,500, while the downward border is placed from the May 15 low near $3,180.86.
The yellow metal wobbles near the 20-day Exponential Moving Average (EMA) around $3,351.00, indicating a sideways trend.
The 14-day Relative Strength Index (RSI) oscillates inside the 40.00-60.00 range, suggesting indecisiveness among market participants.
Looking down, the Gold price would fall towards the round-level support of $3,200 and the May 15 low at $3,121, if it breaks below the May 29 low of $3,245.
Alternatively, the Gold price will enter an uncharted territory if it breaks above the psychological level of $3,500 decisively. Potential resistances would be $3,550 and $3,600.
Gold daily chart
(Click on image to enlarge)
More By This Author:
Pound Sterling Rises On Strong Flash UK PMI Numbers
AUD/USD Extends Losing Streak For Fourth Trading Day, Fed Powell’s Speech In Focus
USD/INR Extends Losing Streak On Upbeat Flash India's PMI Data
Information on these pages contains forward-looking statements that involve risks and uncertainties. Markets and instruments profiled on this page are for informational purposes only and should not ...
more

