
Gold Price Forecast: XAU/USD Remains Within Touching Distance Of $3,400
Image Source: Unsplash
- Gold price looks for a fresh trigger to break above the key resistance of $3,400.
- Fed officials turn dovish on the monetary policy outlook.
- US President Trump is expected to announce the tariff penalty on China for buying Oil from Russia.
Gold price (XAU/USD) struggles to break above $3,400.00 after testing this key level early Thursday. The precious metal hesitates to extend upside even as Federal Reserve (Fed) officials have shown support for interest rate cuts in the remainder of the year.
On Wednesday, Minneapolis Fed President Neel Kashkari, San Francisco Fed President Mary Daly and Fed Governor Lisa Cook argued in favor of reducing interest rates amid growing labor market concerns. “The economy is slowing and the Fed needs to respond to the slowing economy,” Kashkari said in an interview with CNBC. Kashkari added, “It may still be relevant in the near term to begin adjusting the policy rate, and two rate cuts this year still seem appropriate.”
The CME FedWatch tool showed that traders have almost fully priced in a 25 basis points (bps) interest rate reduction in the September policy meeting.
Theoretically, lower interest rates by the Fed bode well for non-yielding assets, such as Gold.
Meanwhile, resurfacing United States (US) President Donald Trump's tariff fears are expected to improve the demand for safe-haven assets, such as Gold. On Wednesday, Trump stated that he could impose a penalty on China in the form of tariffs for buying Oil from Russia. The same day, Trump increased import duties on India by 25% for buying Russian Oil.
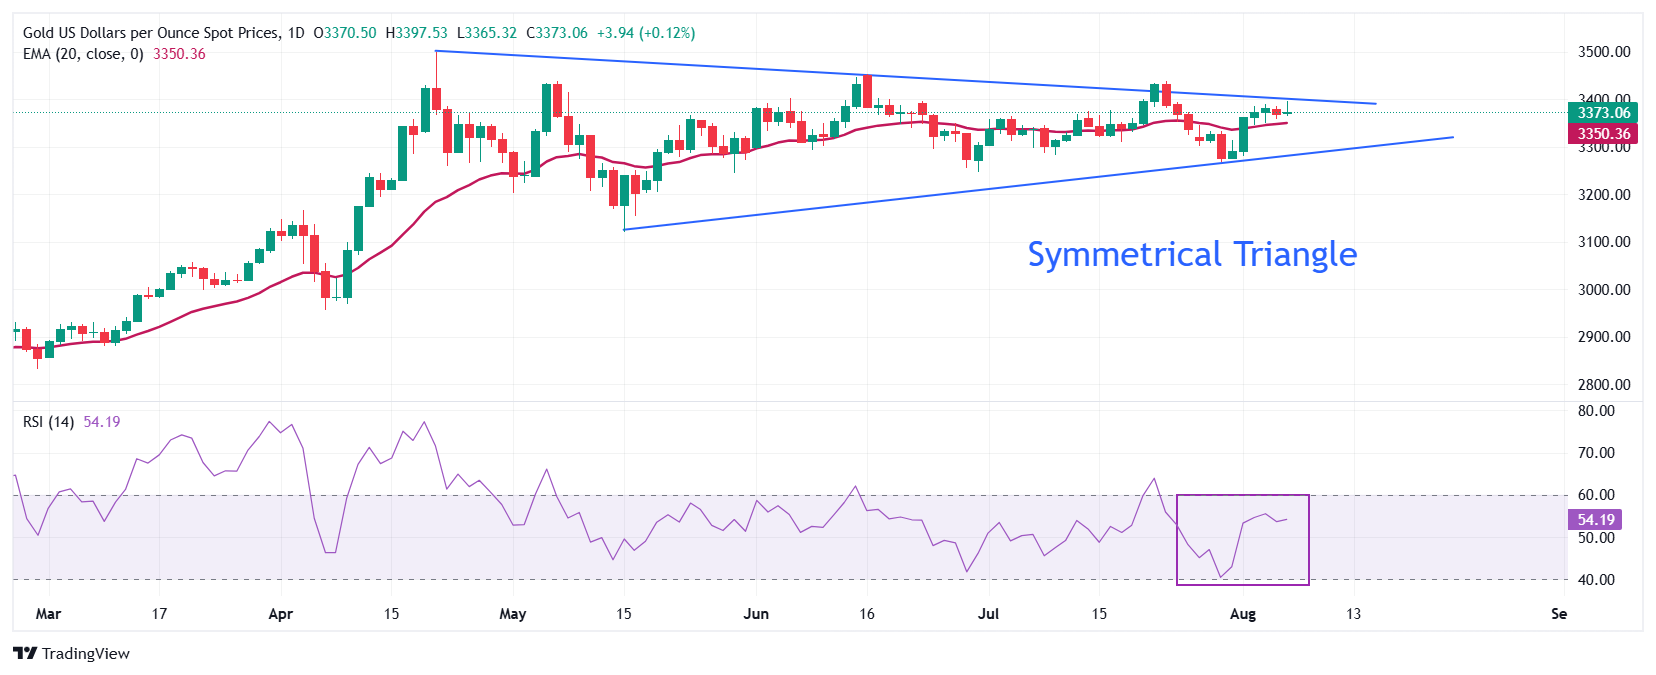
Gold technical analysis
Gold price trades close to the upper boundary of the Symmetrical Triangle formation around $3,400, which is plotted from April’s high near $3,500. The lower boundary of the yellow metal is placed from the May’s low of $3,120.85.
The precious metal holds slightly above the 20-day Exponential Moving Average (EMA), which trades near $3,350, suggesting that the near-term trend is on the upside.
The 14-day Relative Strength Index (RSI) wobbles inside the 40.00-60.00, which indicates indecisiveness among market participants.
Looking down, the Gold price would fall towards the round-level support of $3,200 and the May 15 low at $3,121, if it breaks below the May 29 low of $3,245
Alternatively, the Gold price will enter uncharted territory if it breaks above the psychological level of $3,500 decisively. Potential resistances would be $3,550 and $3,600.
Gold daily chart
More By This Author:
Pound Sterling Trades Calmly While BoE's Monetary Policy Looms LargeUSD/INR Falls Even As Trumps Increases Tariffs On India To 50%
Pound Sterling Trades Sideways While BoE Seems To Cut Interest Rates On Thursday
Information on these pages contains forward-looking statements that involve risks and uncertainties. Markets and instruments profiled on this page are for informational purposes only and should not ...
more

