
Gold price is riding higher on the hawkish central banks’ decisions and year-end flows, having taken out the critical $1,800 mark. The US dollar and yields lick their wounds, lending support to the bright metal. The renewed upside in gold price, however, could remain capped by the expectations of a Santa rally io Wall Street. However, if gold price manages to sustain above the latter, then buyers are likely to remain hopeful for further upside.

Image Source: Pixabay
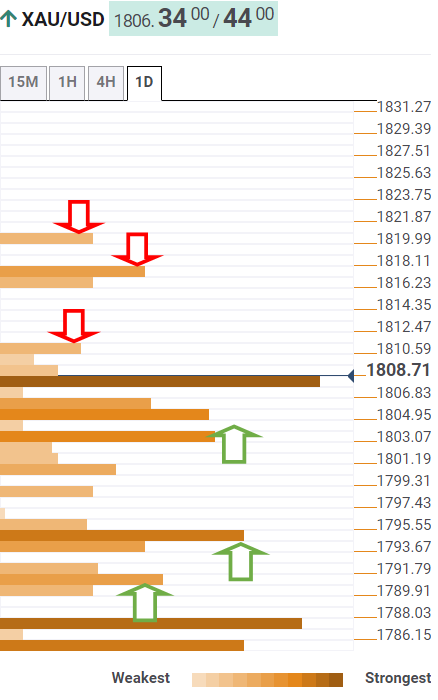
Gold Price: Key levels to watch
The Technical Confluences Detector shows that the gold is trying hard to overcome the $1,808 barrier, which is the convergence of the SMA200 four-hour, pivot point one-day R1 and Fibonacci 161.8% one-week.
If the latter is scaled, then gold bulls will test minor resistance at $1,811, close to the previous high four-hour. Further up, the rally could gain traction towards the confluence of the pivot point one-week R3 and pivot point one-day R2 at $1,818.
The level to beat for gold bulls is seen at $1,820, the Bollinger band one-day Upper.
Alternatively, strong support awaits at $1,804, the intersection of the SMA10 one-hour and Fibonacci 38.2% one-month.
Selling interest could accelerate below the last, opening floors towards the $1800 threshold, below which $1,794 will come to the rescue of gold bulls. At that point, the Fibonacci 23.6% one-day coincides with the pivot point one-week R1 and the previous week’s high.
The last line of defense for buyers is seen at $1,790, the meeting point of the Fibonacci 38.2% one-day and SMA100 one-day.
Here is how it looks on the tool
About Technical Confluences Detector
The TCD (Technical Confluences Detector) is a tool to locate and point out those price levels where there is a congestion of indicators, moving averages, Fibonacci levels, Pivot Points, etc. If you are a short-term trader, you will find entry points for counter-trend strategies and hunt a few points at a time. If you are a medium-to-long-term trader, this tool will allow you to know in advance the price levels where a medium-to-long-term trend may stop and rest, where to unwind positions, or where to increase your position size.


Comments
Log in or sign up to join the conversation.